
|
Date: February 14, 2025
|
|||
|
CREDICORP LTD.
(Registrant)
|
|||
|
By:
|
/s/ Milagros Cigüeñas
|
||
|
Milagros Cigüeñas
|
|||
|
Authorized Representative
|
|||

 |
| |
Earnings Release 4Q / 2024
|
Analysis of 4Q24 Consolidated Results
|
 |
Operating and Financial Highlights | 03 |
|
Senior Management Quotes | 05 |
|
Fourth Quarter 2024 Earnings Conference Call | 06 |
|
Summary of Financial Performance and Outlook | 07 |
|
Financial Overview | 12 |
|
Credicorp’s Strategy Update | 13 |
|
Analysis of 4Q24 Consolidated Results
|
|
01
|
Loan Portfolio
|
17
|
|
|
02
|
Deposits
|
20
|
|
|
03
|
Interest Earning Assets and Funding
|
23
|
|
|
04
|
Net Interest Income (NII)
|
24
|
|
|
05
|
Portfolio Quality and Provisions
|
27
|
|
|
06
|
Other Income
|
31
|
|
|
07
|
Insurance Underwriting Results
|
35
|
|
|
08
|
Operating Expenses
|
37
|
|
|
09
|
Operating Efficiency
|
39
|
|
|
10
|
Regulatory Capital
|
40
|
|
|
11
|
Economic Outlook
|
42
|
|
|
12
|
Appendix
|
46
|
|
| |
Earnings Release 4Q / 2024
|
Analysis of 4Q24 Consolidated Results
|
| • |
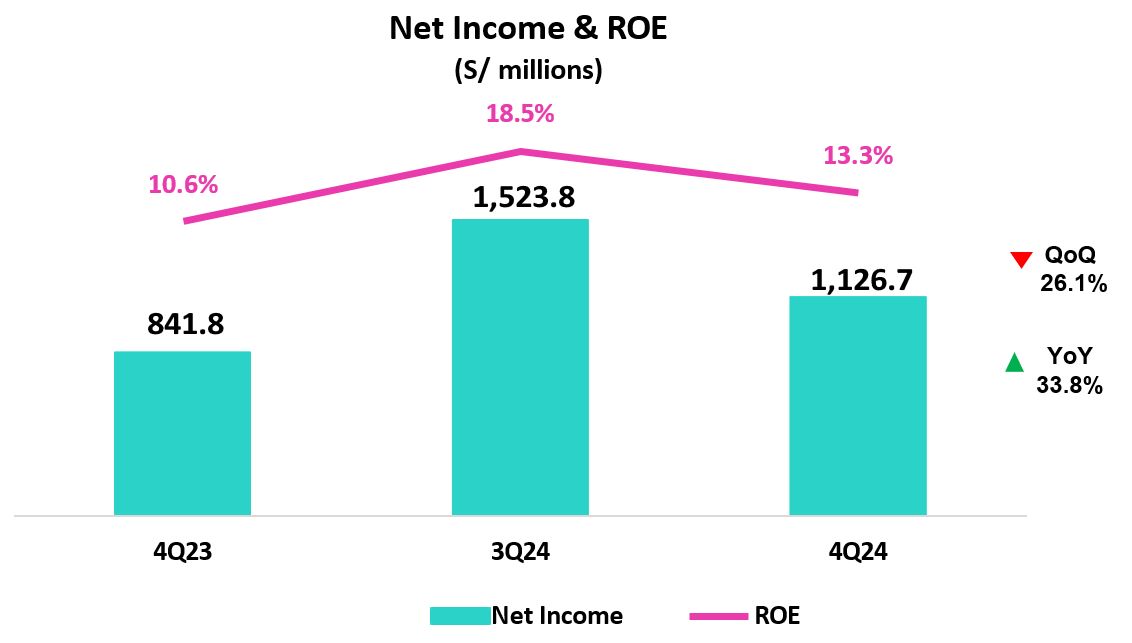
Net Income attributed to Credicorp declined 26.1% QoQ, but increased 33.8% YoY to S/1,126.7 million. As a result, ROE stood at 13.3%,
impacted by a 259 million soles one-offs related to Sartor case. FY24 net income increased 13.1% YoY to a record high of S/5,501 million, with ROE reaching 16.5% and 17.2% when excluding the above- mentioned one-time charge.
|
| • |
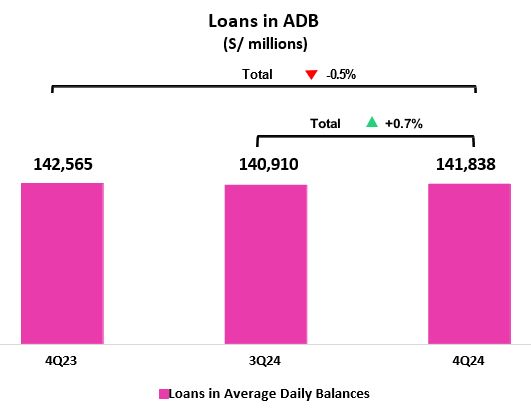
Total Loans, measured in average daily balances (ADB) expanded by 0.7% QoQ, driven mainly by short-term corporate loans, government
program loans at SME-Business and Mortgages - marking an inflection point. YoY, total loans declined 0.5% mainly due to stricter credit policies at Mibanco, higher amortizations
of short-term Middle Market banking loans, and a decrease in long-term SME-Pyme disbursements.
|
| • |
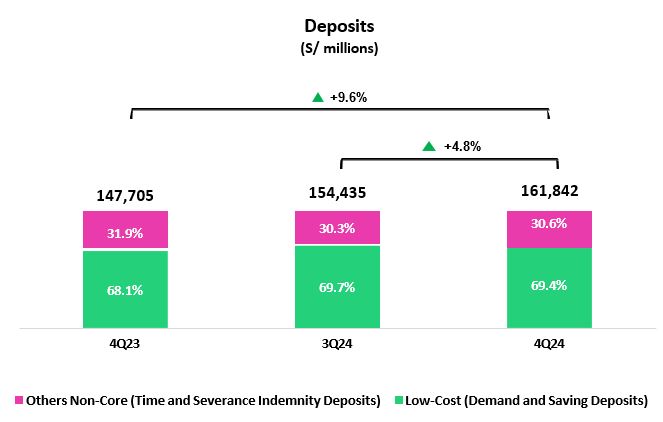
Total Deposits increased by 4.8% QoQ due to a seasonal increase in savings deposits, and 9.6% YoY driven by Low- Cost deposits, in the
context of higher system liquidity. Low-cost deposits accounted for 69.4% of total deposits.
|
| • |
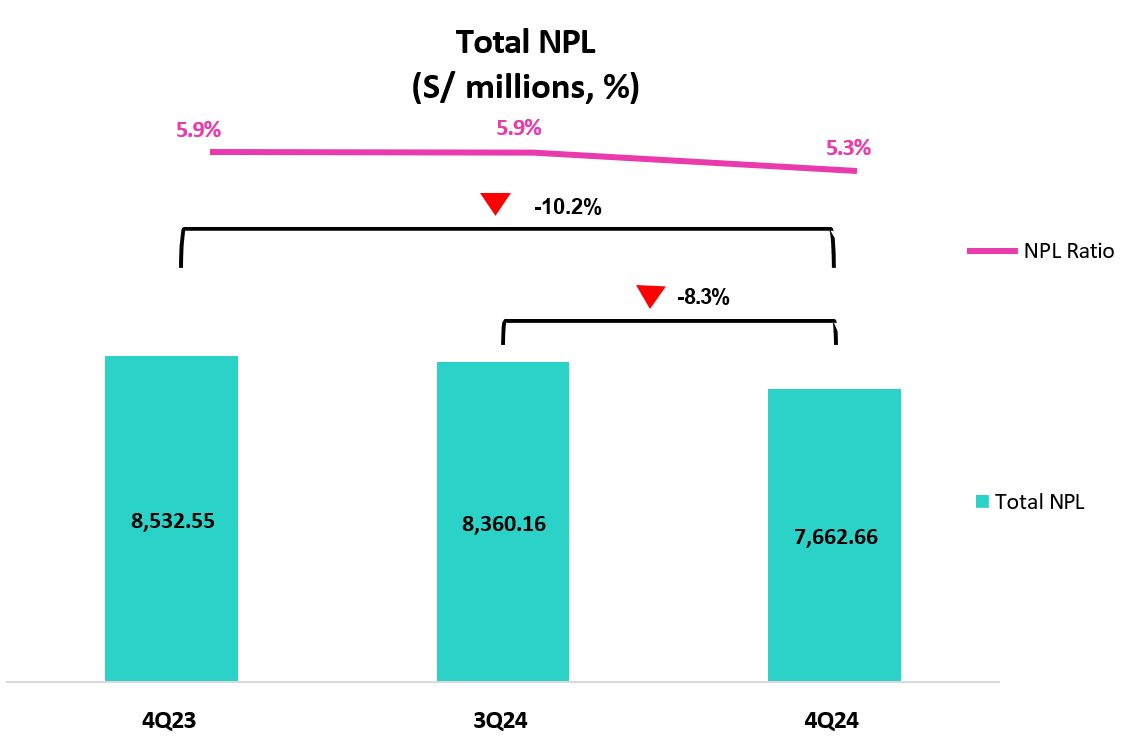
NPL Ratio improved 60 bps QoQ and 63 bps YoY to 5.3%, which reflected improvements in risk management measures and repayments at BCP and
Mibanco.
|
| • |
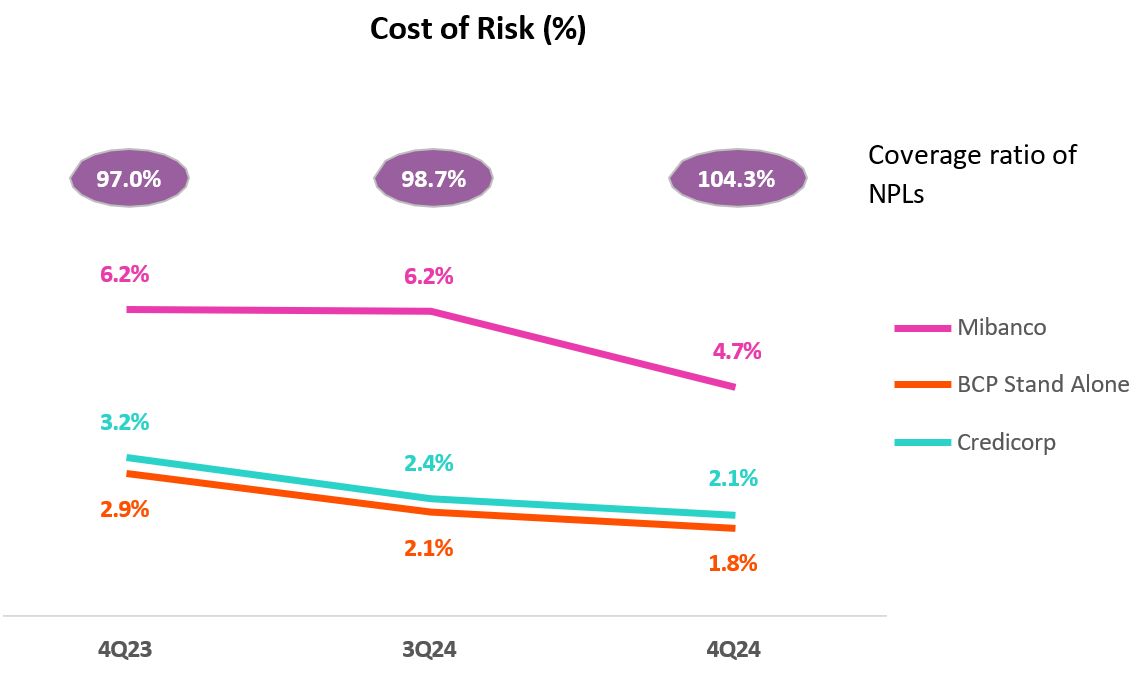
Provisions fell 14.4% QoQ, driven by better payment performance in SMEs and Individuals. CoR declined to 2.1%, down 34 bps QoQ and 118
bps YoY, allowing for proactive lending at both BCP and Mibanco.
|
| • |
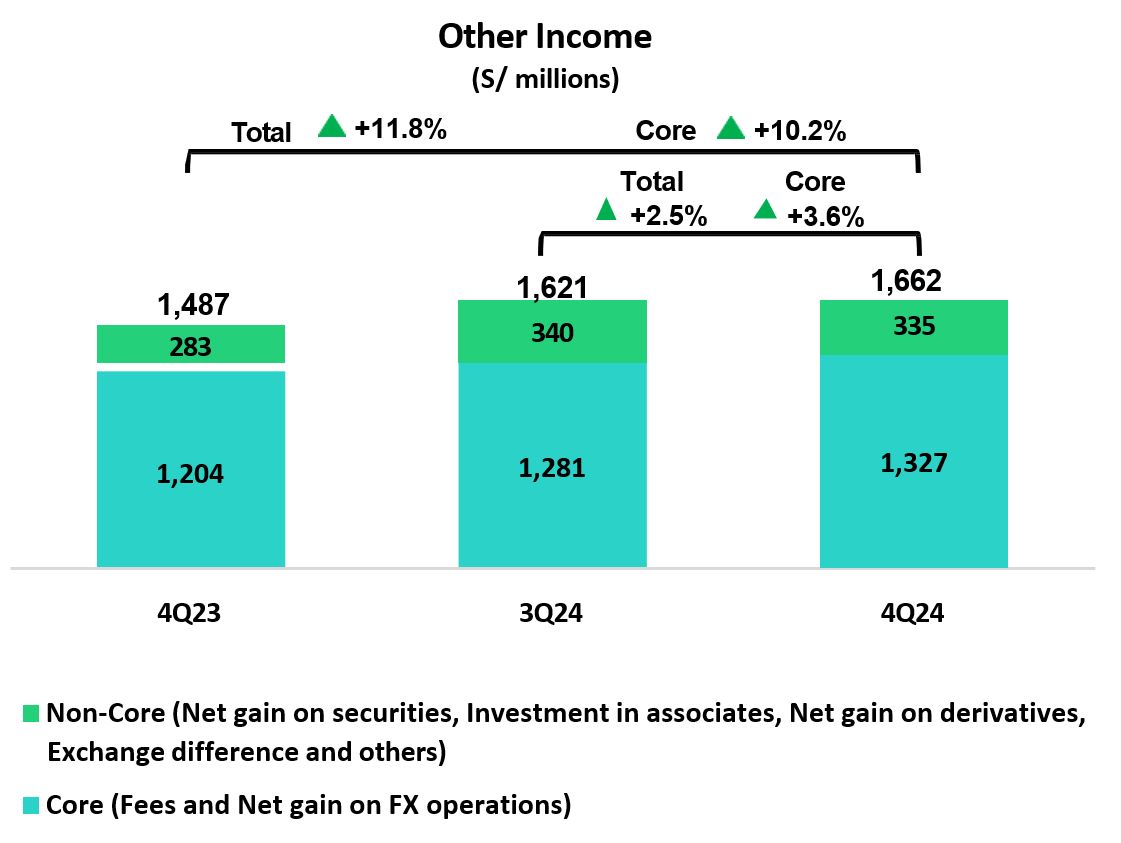
Core Income expanded by 1.7% QoQ and 8.9% YoY, driven by solid NII and record-high transactional volumes, mainly via growth in digital
transactions and FX.
|
| • |
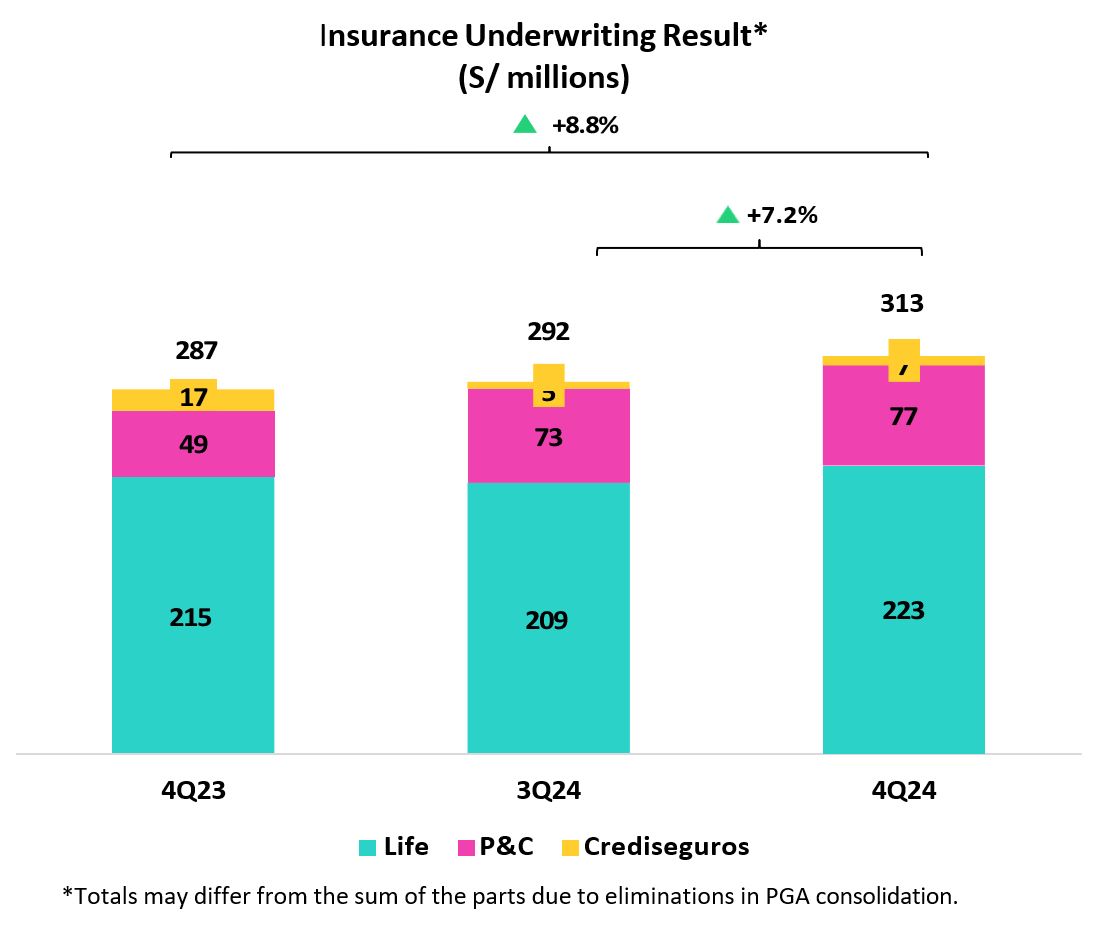
Insurance Underwriting Results increased by 7.2% QoQ, largely driven by stronger reinsurance results in the P&C business, and was up
8.8% YoY.
|
| • |
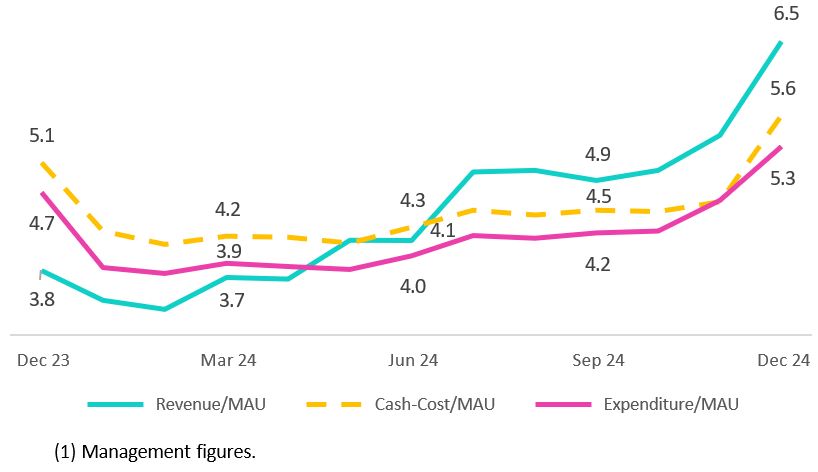
Yape reached 13.7 million Monthly Active Users (MAU), with an average of 51 monthly transactions per user. After reaching break-even in
May 2024, the super app continues its growth trajectory across its three business lines: payments, financial and e-commerce. In 4Q24, monthly revenues per active user increased to S/6.5, while costs per active user reached S/5.3, due to
seasonal expenses recorded during the quarter.
|
| • |
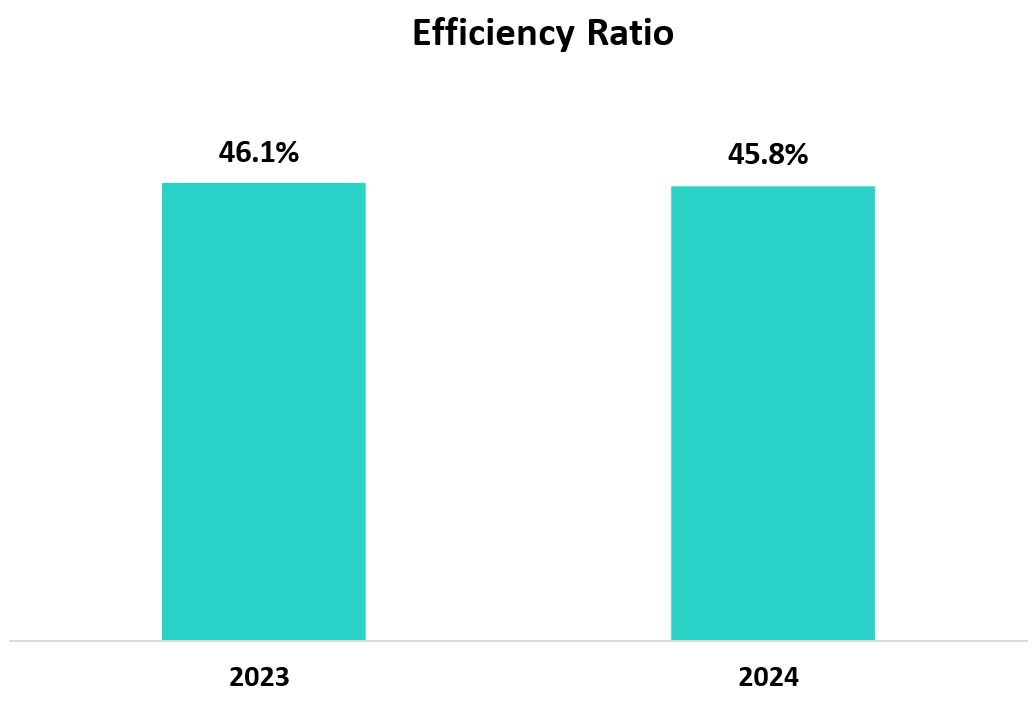
Efficiency Ratio improved 30 bps YoY to 45.8% for FY24, reflecting mainly growth in interest income and fee income. Operating expenses
increased 9.4% YoY, primarily due to BCP´s core business and disruptive initiatives at Credicorp, where expenses rose 27.1%. Yape, Tenpo and Culqi were the main consumers of expenses, representing 61% of total expenses for disruptive
initiatives.
|
| • |
Strong capital base, with IFRS CET1 Ratio at BCP at 13.32% at quarter-end, down 10 bps QoQ, while Mibanco’s IFRS CET1 Ratio declined 83
bps to 17.53% in the same period.
|
|
| |
Earnings Release 4Q / 2024
|
Analysis of 4Q24 Consolidated Results
|

|
| |
Earnings Release 4Q / 2024
|
Analysis of 4Q24 Consolidated Results
|
|
Fourth Quarter 2024 Earnings Conference Call
|
|
| |
Earnings Release 4Q / 2024
|
Analysis of 4Q24 Consolidated Results
|
|
|
|
| |
Earnings Release 4Q / 2024
|
Analysis of 4Q24 Consolidated Results
|
|
| |
Earnings Release 4Q / 2024
|
Analysis of 4Q24 Consolidated Results
|
|
|
|
| |
Earnings Release 4Q / 2024
|
Analysis of 4Q24 Consolidated Results
|
|
ROE
|
ROE
|
ROE
|
ROE
|
ROE
|
ROE
|
ROE
|
ROE
|
|||||||
|
20.1%
|
9.5%
|
17.3%
|
12.9%
|
20.5%
|
19.7%
|
18.0%
|
-1.4%
|
|||||||
|
1,131.1
|
|
(1)
|
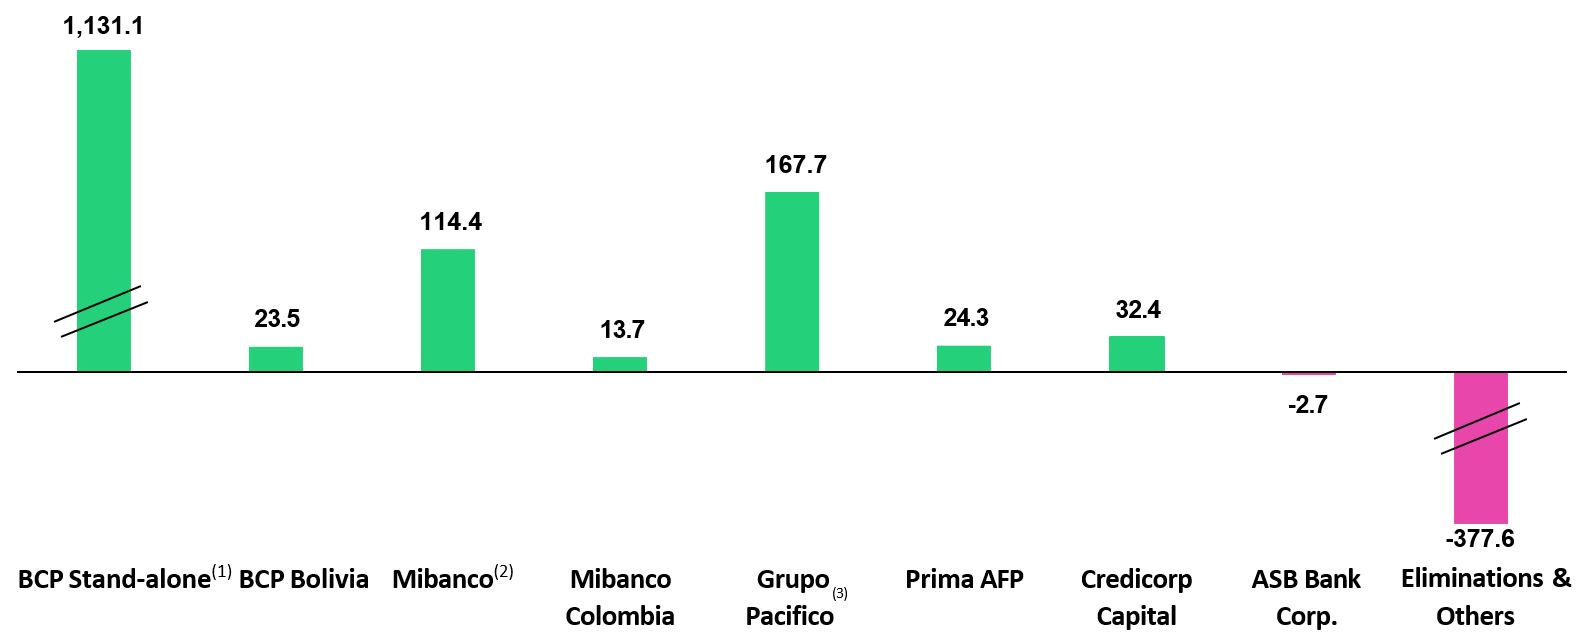
In BCP Stand-alone, the figure is lower than the net profit since the contribution eliminates investment gains in other subsidiaries of Credicorp (Mibanco)
|
|
(2)
|
In Mibanco, the figure is less than the net profit because Credicorp owns (directly and indirectly) 99.921% of Mibanco.
|
|
(3)
|
The contribution of Grupo Pacífico presented here is greater than the profit of Pacifico Seguros since 100% of Crediseguros is being included (including 48% under Grupo
Crédito).
|
|
| |
Earnings Release 4Q / 2024
|
Analysis of 4Q24 Consolidated Results
|
|
Universal Banking
|
|
BCP registered a strong performance, which was mainly driven by resilient margins amid a shift in the loan portfolio to retail and solid transactional
funding, alongside diversified income streams. NIM stood at 6.0%, primarily bolstered by an improvement in the funding cost, and by uptick in the yield on interest earning assets. Other core income rose 15.2%, as fee income was
boosted by Yape´s consolidation as a key revenue stream and BCP´s strong transactional activity. These dynamics were partially offset by growth in operating expenses.
|
|
Insurance and Pensions
|
|
Grupo Pacifico concluded 2024 with another year of remarkable performance, achieving an ROE of 23.7% on the back of solid commercial dynamics in
both the P&C and Life business lines. Net Income slightly dropped 5% mainly driven by (i) lower Insurance Underwriting Results, due to normalization of underwriting margins in the Life business, and (ii) higher Operating
Expenses.
|
|
Microfinance
|
|
In 2024, Mibanco registered a 51.7% increase in Net Income. This evolution was mainly driven by a drop in provisions, which fell due to the risk-
management measures implemented and to growth in Net interest income, which rose on the back of active pricing management of loans and a reduction in the cost of funding.
Mibanco Colombia's results improved significantly thanks to a focus on efficiency and disciplined risk processes and controls,
despite a challenging business environment. This helped us become the third largest private microfinance lender in Colombia.
|
|
Investment Management
and Advisory
|
|
Operating dynamics have been strong throughout the year for IM&A, which affirms that our new strategic approach is on target and puts us in
good stead for 2025. Excluding one-offs for the Sartor case, net income rose 15%, led primarily by Sales activities in our Capital Markets Business. Our Wealth and Asset Management businesses also contributed to growth in net income.
|
|
Outlook
|
|
We expect to close the year in 2025 with a ROE around 17.5%. We anticipate that this result will be
driven by: (i) growth in our loan portfolio, particularly in the retail segment, (ii) the resilience of our NIM, and (iii) a reduction in the cost of
risk.
|
|
| |
Earnings Release 4Q / 2024
|
Analysis of 4Q24 Consolidated Results
|
|
Financial Overview
|
|
Credicorp Ltd.
|
Quarter
|
% change
|
Up to
|
% change
|
||||
|
S/000
|
4Q23
|
3Q24
|
4Q24
|
QoQ
|
YoY
|
Dec 23
|
Dec 24
|
Dec 24 / Dec 23
|
|
Net interest, similar income and expenses
|
3,347,684
|
3,590,750
|
3,629,794
|
1.1%
|
8.4%
|
12,937,972
|
14,115,131
|
9.1%
|
|
Provision for credit losses on loan portfolio, net of recoveries
|
(1,173,454)
|
(868,081)
|
(743,296)
|
-14.4%
|
-36.7%
|
(3,622,345)
|
(3,519,447)
|
-2.8%
|
|
Net interest, similar income and expenses, after provision for credit losses on loan portfolio
|
2,174,230
|
2,722,669
|
2,886,498
|
6.0%
|
32.8%
|
9,315,627
|
10,595,684
|
13.7%
|
|
Total other income
|
1,486,823
|
1,621,282
|
1,661,964
|
2.5%
|
11.8%
|
5,655,825
|
6,404,119
|
13.2%
|
|
Insurance underwriting result
|
287,295
|
291,775
|
312,683
|
7.2%
|
8.8%
|
1,211,100
|
1,199,020
|
-1.0%
|
|
Total expenses
|
(2,661,542)
|
(2,524,166)
|
(3,105,459)
|
23.0%
|
16.7%
|
(9,334,223)
|
(10,374,296)
|
11.1%
|
|
Profit before income tax
|
1,286,806
|
2,111,560
|
1,755,686
|
-16.9%
|
36.4%
|
6,848,329
|
7,824,527
|
14.3%
|
|
Income tax
|
(434,648)
|
(555,117)
|
(598,348)
|
7.8%
|
37.7%
|
(1,888,451)
|
(2,201,275)
|
16.6%
|
|
Net profit
|
852,158
|
1,556,443
|
1,157,338
|
-25.6%
|
35.8%
|
4,959,878
|
5,623,252
|
13.4%
|
|
Non-controlling interest
|
10,331
|
32,655
|
30,625
|
-6.2%
|
196.4%
|
94,338
|
121,998
|
29.3%
|
|
Net profit attributable to Credicorp
|
841,827
|
1,523,788
|
1,126,713
|
-26.1%
|
33.8%
|
4,865,540
|
5,501,254
|
13.1%
|
|
Dividends paid to third parties
|
0
|
875,992
|
0
|
-100.0%
|
n.a.
|
1,994,037
|
3,667,644
|
83.9%
|
|
Net income / share (S/)
|
10.6
|
19.1
|
14.1
|
-26.1%
|
33.8%
|
61.0
|
69.0
|
13.1%
|
|
Dividends per Share (S/)
|
0.0
|
11.0
|
0.0
|
-100.0%
|
-100.0%
|
25.0
|
46.0
|
83.9%
|
|
Loans
|
144,976,051
|
142,568,785
|
145,732,273
|
2.2%
|
0.5%
|
144,976,051
|
145,732,273
|
0.5%
|
|
Deposits and obligations
|
147,704,994
|
154,435,451
|
161,842,066
|
4.8%
|
9.6%
|
147,704,994
|
161,842,066
|
9.6%
|
|
Net equity
|
32,460,004
|
33,462,591
|
34,346,451
|
2.6%
|
5.8%
|
32,460,004
|
34,346,451
|
5.8%
|
|
Profitability
|
||||||||
|
Net interest margin(1)
|
6.20%
|
6.43%
|
6.34%
|
-9 bps
|
14 bps
|
6.00%
|
6.29%
|
29 bps
|
|
Risk-adjusted Net interest margin
|
4.10%
|
4.93%
|
5.08%
|
15 bps
|
98 bps
|
4.38%
|
4.77%
|
39 bps
|
|
Funding cost(2)
|
3.0%
|
2.7%
|
2.6%
|
-12 bps
|
-47 bps
|
2.9%
|
2.7%
|
-21 bps
|
|
ROAE
|
10.6%
|
18.5%
|
13.3%
|
-521 bps
|
273 bps
|
15.8%
|
16.5%
|
63 bps
|
|
ROAA
|
1.4%
|
2.4%
|
1.8%
|
-67 bps
|
37 bps
|
2.1%
|
2.2%
|
17 bps
|
|
Loan portfolio quality
|
||||||||
|
Internal overdue ratio(3)
|
4.2%
|
4.2%
|
3.7%
|
-51 bps
|
-51 bps
|
4.2%
|
3.7%
|
-51 bps
|
|
Internal overdue ratio over 90 days
|
3.2%
|
3.4%
|
3.0%
|
-39 bps
|
-19 bps
|
3.2%
|
3.0%
|
-19 bps
|
|
NPL ratio(4)
|
5.9%
|
5.9%
|
5.3%
|
-60 bps
|
-63 bps
|
5.9%
|
5.3%
|
-63 bps
|
|
Cost of risk(5)
|
3.2%
|
2.4%
|
2.1%
|
-34 bps
|
-118 bps
|
2.5%
|
2.4%
|
-5 bps
|
|
Coverage ratio of IOLs
|
135.1%
|
136.9%
|
147.4%
|
1052 bps
|
1230 bps
|
135.1%
|
147.4%
|
1230 bps
|
|
Coverage ratio of NPLs
|
97.0%
|
98.7%
|
104.3%
|
566 bps
|
732 bps
|
97.0%
|
104.3%
|
732 bps
|
|
Operating efficiency
|
||||||||
|
Operating income(6)
|
4,893,605
|
5,287,099
|
5,475,434
|
3.6%
|
11.9%
|
19,056,189
|
20,976,379
|
10.1%
|
|
Operating expenses(7)
|
2,395,688
|
2,389,261
|
2,692,110
|
12.7%
|
12.4%
|
8,780,760
|
9,601,950
|
9.4%
|
|
Efficiency ratio(8)
|
49.0%
|
45.2%
|
49.2%
|
398 bps
|
21 bps
|
46.1%
|
45.8%
|
-30 bps
|
|
Operating expenses / Total average assets
|
4.0%
|
3.8%
|
4.3%
|
42 bps
|
24 bps
|
3.7%
|
3.9%
|
18 bps
|
|
Capital adequacy - BCP Stand-alone
|
||||||||
|
Global Capital Ratio(9)
|
17.46%
|
18.96%
|
18.71%
|
-25 bps
|
125 bps
|
17.46%
|
18.71%
|
125 bps
|
|
Ratio Tier 1(10)
|
13.09%
|
13.25%
|
13.08%
|
-17 bps
|
-1 bps
|
13.09%
|
13.08%
|
-1 bps
|
|
Ratio common equity tier 1(11) (13)
|
13.20%
|
13.42%
|
13.32%
|
-10 bps
|
12 bps
|
13.20%
|
13.32%
|
12 bps
|
|
Capital adequacy - Mibanco
|
||||||||
|
Global Capital Ratio(9)
|
20.65%
|
20.22%
|
19.42%
|
-80 bps
|
-123 bps
|
20.65%
|
19.42%
|
-123 bps
|
|
Ratio Tier 1(10)
|
18.26%
|
17.85%
|
17.07%
|
-78 bps
|
-119 bps
|
18.26%
|
17.07%
|
-119 bps
|
|
Ratio common equity tier 1(11) (13)
|
18.37%
|
18.35%
|
17.53%
|
-83 bps
|
-84 bps
|
18.37%
|
17.53%
|
-84 bps
|
|
Employees
|
36,947
|
38,642
|
38,676
|
0.1%
|
4.7%
|
36,947
|
38,676
|
470.0%
|
|
Share Information
|
||||||||
|
Issued Shares
|
94,382
|
94,382
|
94,382
|
0.0%
|
0.0%
|
94,382
|
94,382
|
0.0%
|
|
Treasury Shares(12)
|
14,886
|
14,948
|
14,948
|
0.0%
|
0.4%
|
14,886
|
14,948
|
0.4%
|
|
Outstanding Shares
|
79,496
|
79,434
|
79,434
|
0.0%
|
-0.1%
|
79,496
|
79,434
|
-0.1%
|
|
(1)
|
Net Interest Margin = Net Interest Income (Excluding Net Insurance Financial Expenses) / Average Interest Earning Assets
|
|
(2)
|
Funding Cost = Interest Expense (Does not include Net Insurance Financial Expenses) / Average Funding
|
|
(3)
|
Internal Overdue Loans: includes overdue loans and loans under legal collection, according to our internal policy for overdue loans. Internal Overdue Ratio: Internal overdue
loans / Total loans
|
|
(4)
|
Non-performing loans (NPL): Internal overdue loans + Refinanced loans. NPL ratio: NPL / Total loans.
|
|
(5)
|
Cost of risk = Annualized provision for loan losses, net of recoveries / Total loans.
|
|
(6)
|
Operating Income = Net interest, similar income and expenses + Fee Income+ Net gain on foreign exchange transactions + Net Gain From associates + Net gain on derivatives held
for trading + Result on exchange differences + Insurance Underwriting Result
|
|
(7)
|
Operating Expenses = Salaries and employee benefits + Administrative expenses + Depreciation and amortization + Association in participation + Acquisition cost.
|
|
(8)
|
Efficiency Ratio = (Salaries and employee benefits + Administrative expenses + Depreciation and amortization + Association in participation) / (Net interest, similar income and
expenses + Fee Income+ Net gain on foreign exchange transactions + Net Gain From associates + Net gain on derivatives held for trading + Result on exchange differences + Insurance Underwriting Result)
|
|
(9)
|
Regulatory Capital / Risk-weighted assets (legal minimum = 10% since July 2011).
|
|
(10)
|
Tier 1 = Capital + Legal and other capital reserves + Accumulated earnings with capitalization agreement + (0.5 x Unrealized profit and net income in
subsidiaries) - Goodwill - (0.5 x Investment in subsidiaries) + Perpetual subordinated debt (maximum amount that can be included is 17.65% of Capital + Reserves + Accumulated earnings with capitalization agreement + Unrealized profit and
net income in subsidiaries - Goodwill).
|
|
(11)
|
Common Equity Tier I = Capital + Reserves – 100% of applicable deductions (investment in subsidiaries, goodwill, intangibles and net deferred taxes that
rely on future profitability) + retained earnings
|
|
(12)
|
Consider shares held by Atlantic Security Holding Corporation (ASHC) and stock awards.
|
|
(13)
|
Common Equity Tier I calculated based on IFRS Accounting
|
|
| |
Earnings Release 4Q / 2024
|
Analysis of 4Q24 Consolidated Results
|
|
Credicorp’s Strategy Update
|
|
Transformation of traditional businesses (1)
|
Subsidiary
|
4Q23
|
3Q24
|
4Q24
|
|
Day-to-day
|
||||
|
Digital Clients(2)
|
BCP
|
68%
|
74%
|
76%
|
|
Digital monetary transactions (3)
|
BCP
|
80%
|
85%
|
86%
|
|
Transactional cost by unit
|
BCP
|
0.07
|
0.04
|
0.04
|
|
Disbursements through leads (4)
|
Mibanco
|
71%
|
66%
|
65%
|
|
Disbursements through alternative channels (5)
|
Mibanco
|
13%
|
23%
|
24%
|
|
Mibanco Productivity (6)
|
Mibanco
|
21.6
|
23.6
|
24.5
|
|
Cashless
|
||||
|
Cashless transactions(7)
|
BCP
|
60%
|
66%
|
69%
|
|
Mobile Banking rating iOS
|
BCP
|
4.7
|
4.8
|
4.8
|
|
Mobile Banking rating Android
|
BCP
|
4.7
|
4.7
|
4.7
|
|
Digital Acquisition
|
||||
|
Digital sales (8)
|
BCP
|
58%
|
65%
|
74%
|
|
(1)
|
Figures for December 2023, September 2024, and December 2024.
|
|
(2)
|
Clients that made 70%, or more, of their transactions through digital channels in the last 6 months (includes Yape).
|
|
(3)
|
Monetary Transactions conducted through Mobile Banking, Internet Banking, Yape and Telecredito/Total Monetary Transactions in Retail Banking.
|
|
(4)
|
Disbursements generated through leads/Total disbursements.
|
|
(5)
|
Disbursements conducted through alternative channels/Total disbursements. Figures differ from previously reported due to a methodological change.
|
|
(6)
|
Number of loans disbursed/Total relationship managers.
|
|
(7)
|
Amount transacted through Mobile Banking, Internet Banking, Yape y POS/Total amount transacted through Retail Banking. Figures differ from previously reported due to a
methodological change.
|
|
(8)
|
Units sold by Retail Banking through digital channels/Total number of units sold by Retail Banking.
|
|
| |
Earnings Release 4Q / 2024
|
Analysis of 4Q24 Consolidated Results
|
|
Credicorp’s Strategy Update
|
|
|
|
Management KPIs
|
Quarter |
Change %
|
Up to
|
Change %
|
||||
|
4Q23
|
3Q24
|
4Q24
|
QoQ
|
YoY
|
Dec 23
|
Dec 24
|
Dec 24 / Dec 23
|
|
|
Users
|
||||||||
|
Users (millions)
|
14.2
|
16.6
|
17.3
|
4.2%
|
21.6%
|
14.2
|
17.3
|
21.6%
|
|
Monthly Active Users (MAU) (millions) (1)
|
10.7
|
13.0
|
13.7
|
5.3%
|
28.1%
|
10.7
|
13.7
|
28.1%
|
|
Fee Income Generating MAU (millions)
|
7.9
|
10.4
|
11.4
|
9.6%
|
44.9%
|
7.9
|
11.4
|
44.9%
|
|
Engagement
|
||||||||
|
# Transactions (millions)
|
1,027.9
|
1,664.2
|
1,953.1
|
17.4%
|
90.0%
|
2,918.0
|
6,145.7
|
110.6%
|
|
Experience
|
||||||||
|
NPS (2)
|
80
|
74
|
79
|
5.0%
|
-1.0%
|
80
|
79
|
-1.0%
|
|
Metric per Monthly Active User (MAU) (3)
|
||||||||
|
# Monthly Transactions / MAU
|
35.3
|
44.1
|
51.1
|
15.8%
|
44.6%
|
35.3
|
51.1
|
44.6%
|
|
# Average Functionalities / MAU
|
2.2
|
2.4
|
2.6
|
6.3%
|
18.1%
|
2.2
|
2.6
|
18.1%
|
|
Monthly Revenues / MAU (S/)
|
3.8
|
4.9
|
6.5
|
34.4%
|
72.9%
|
3.8
|
6.5
|
72.9%
|
|
Monthly Expenses / MAU (S/)
|
4.7
|
4.2
|
5.3
|
24.5%
|
11.7%
|
4.7
|
5.3
|
11.7%
|
|
Monthly Cash Cost / MAU (S/)
|
5.1
|
4.5
|
5.6
|
25.4%
|
11.2%
|
5.1
|
5.6
|
11.2%
|
|
Drivers Monetización
|
||||||||
|
Payments
|
||||||||
|
TPV (4) (S/, billions)
|
47.1
|
76.8
|
90.3
|
17.6%
|
91.6%
|
137.9
|
279.5
|
102.8%
|
|
# Bill Payments transactions (millions)
|
18.1
|
34.6
|
40.5
|
17.0%
|
124.1%
|
34.4
|
127.1
|
269.6%
|
|
Financials
|
||||||||
|
# Loans Disbursements (thousands)
|
293.2
|
1294.9
|
2143.1
|
65.5%
|
630.8%
|
854.3
|
4612.5
|
439.9%
|
|
E-Commerce
|
||||||||
|
GMV (5) (S/, millions)
|
39.3
|
112.9
|
116.4
|
3.0%
|
196.4%
|
100.9
|
358.0
|
254.7%
|
|
(1)
|
Yape users that have made at least one transaction over the last month.
|
|
(2)
|
Net Promoter Score.
|
|
(3)
|
Management Figures.
|
|
(4)
|
Total Payment Volume, includes the following functionalities: Bill Payments, QRs payments, Mobile Top-ups, Yape Businesses, Money Exchange, Checkout, and Remittances.
|
|
(5)
|
Gross Merchant Volume, includes the following functionalities: Yape Promos, Yape Store, Ticketing, Gaming, Delivery, Buses, Insurance and Gas.
|
|
•
|
Payment: the main drivers are (i) the Total Payment Volume (TPV), which reached S/90.3 billion (+17.6% QoQ and +1.9x YoY) and (ii)
transactions in Bill Payments, which totaled 40.5 million (+17.0% QoQ and +2.2x YoY).
|
|
•
|
Financial: excluding floating (remuneration-based funds transacted through Yape that are held in BCP), the main driver of monetization
is Yape Lending, with 2,143.1 thousand disbursements (+65.5% and +7.3x YoY).
|
|
•
|
E-Commerce: Yape monetizes mainly through the Gross Market Volume (GMV) transacted, which was S/116.4 million (+3.0% QoQ and +3.0x
YoY).
|
|
| |
Earnings Release 4Q / 2024
|
Analysis of 4Q24 Consolidated Results
|
|
Credicorp’s Strategy Update
|
|
Financial results (1)
S/ millions
|
Quarter
|
Change %
|
Up to
|
Change %
|
||||
|
4Q23
|
3Q24
|
4Q24
|
QoQ
|
YoY
|
Dec 23
|
Dec 24
|
Dec 24 / Dec 23
|
|
|
Net Interest Income
|
54.8
|
75.0
|
94.2
|
25.6%
|
71.9%
|
163.0
|
283.6
|
74.0%
|
|
Net Fee Income (2)
|
52.5
|
114.7
|
139.0
|
21.1%
|
164.8%
|
127.8
|
400.1
|
213.0%
|
|
Total Income
|
107.3
|
189.7
|
233.2
|
22.9%
|
117.3%
|
290.8
|
683.7
|
135.1%
|
|
Total Expenses
|
- 137.5
|
- 161.5
|
- 195.6
|
21.1%
|
42.2%
|
- 444.1
|
- 624.4
|
40.6%
|
|
(1)
|
Management figures.
|
|
(2)
|
Includes fee income recorded in BCP from the Payments and E-Commerce businesses.
|
|
| |
Earnings Release 4Q / 2024
|
Analysis of 4Q24 Consolidated Results
|
|
Credicorp’s Strategy Update
|
|
•
|
Portfolio Emissions:
|
|
o
|
Credicorp signed a commitment to become a signatory to the PCAF (Partnership for Carbon Accounting Financials), a global initiative to standardize
measurement and disclosure of the greenhouse gas emissions (GEI) associated with loans and investments.
|
|
o
|
We completed our measurement of the emissions generated by prioritized segments in the wholesale loan portfolio at BCP and BCP Bolivia; prioritized
portfolios at Prima AFP, Pacifico Seguros and Credicorp Capital; and the prioritized underwriting portfolio at Pacifico Seguros. The objective is to determine the indirect environmental impact generated by our activities.
|
|
•
|
Sustainable Finance:
|
|
o
|
As part of our objective to accompany clients in their quest to incorporate best socio-environmental practices, BCP disbursed +US$ 1500 in financing in
2024. Additionally, BCP structured its first Sustainability Linked Loan (SLL), which offers incentives in lending conditions if compliance with environmental and social KPIs is verified.
|
|
o
|
Mibanco Colombia announced the launch of a Sustainable Term Certificate of Deposit, which is a time deposit for institutional investors that seeks to
generate a positive impact by earmarking captured funds for use in the Crédito Mujeres pa’ lante and Crédito Agropecuario progams. Funds are disbursed to clients that meet the criteria set
forth in the Sustainable Financing Framework at Mibanco Colombia.
|
|
•
|
Reporting: At the end of the 1Q25, we will publish the second edition of Credicorp’s TCFD Report, which will provide information on
results in 2024 and be aligned with the annual Sustainability Report.
|
|
•
|
BCP and Yape have financially included 5.7 MM people, which represents growth of 1.8 MM people versus the figure in 2023.
|
|
•
|
Mibanco Perú banked 58 thousand people this year, 62% of which were women. More than 51 thousand clients have received Crediagua loans, whose purpose is to improve the
quality of life of recipients by financing sanitary initiatives.
|
|
•
|
Pacífico Seguros placed 3.6 MM in inclusive insurance policies, an increase of 420 thousand over last year’s loan amount. This is part of our commitment to protect more
people.
|
|
| |
Earnings Release 4Q / 2024
|
Analysis of 4Q24 Consolidated Results
|
|
Credicorp’s Strategy Update
|
|
Progress on initiatives
|
Company
|
2022
|
2023
|
2024
|
|
Financial Inclusion
|
||||
|
Financially included through BCP and Yape – cumulative since 2020 (1)
|
BCP
|
2.5 million
|
3.8 million
|
5.7 million
|
|
Stock of inclusive insurance policies
|
Pacífico Seguros
|
2.6 million
|
3.2 million
|
3.6 million
|
|
Financial Education
|
||||
|
Trained through online courses via ABC at BCP (“ABC del BCP”) – YTD
|
BCP
|
310 thousand
|
614 thousand
|
521 thousand
|
|
Consumer Clients who changed at least one financial behavior towards a healthier or greater banking use – YTD
|
BCP
|
136 thousand
|
214 thousand
|
345 thousand
|
|
Young people trained through the ABC of the Pension Culture (“ABC de la Cultura Previsional”) – YTD
|
Prima AFP
|
61 thousand
|
138 thousand
|
423 thousand
|
|
Clients trained in FE through Mibanco “Progress Academy” programs (“Academia del Progreso”) – YTD(2)
|
Mibanco Perú
|
251 thousand
|
413 thousand
|
405 thousand
|
|
Client company employees trained and certified through “Protege 365” – YTD
|
Pacífico Seguros
|
36 thousand
|
33 thousand
|
52 thousand
|
|
Opportunities and Products for Women
|
||||
|
Number of clients with “Credito Mujer” disbursements
|
Mibanco Perú
|
31 thousand
|
51 thousand
|
39 thousand
|
|
Percentage of women banked on the asset side (loans)
|
Mibanco Perú
|
56%
|
56%
|
62%
|
|
Helping small businesses grow
|
||||
|
Trained via Accompanying Entrepreneurs (“Contigo Emprendedor”) – YTD
|
BCP
|
111 thousand
|
121 thousand
|
68 thousand
|
|
SME-Pymes financially included through loans (working capital and invoice discounting) – YTD
|
BCP
|
49 thousand
|
33 thousand
|
39 thousand (3)
|
|
Microbusiness affiliated to Yape – YTD
|
BCP
|
NA
|
78 thousand
|
104 thousand
|
|
(1)
|
Stock of financially included clients through BCP since 2020: (i) New clients with savings accounts or affiliated to Yape. (ii) New clients without debt
in the financial system or BCP products in the last twelve months. (iii) Clients with 3 monthly average transactions in the last three months. The figure for 4Q23 has been revised.
|
|
(2)
|
Covers virtual or in-person trainings about risk management for businesses, entrepreneurship, and finance through our different educational strategies,
such as the Basic Program for Digital Guidance, Powerful Women and MiConsultor.
|
|
(3)
|
Up to November.
|
|
| |
Earnings Release 4Q / 2024
|
Analysis of 4Q24 Consolidated Results
|
| 01 | Loan Portfolio |
|
This quarter, total loans in average daily balances (ADB) increased 0.7% (+0.3% FX Neutral). Notably, this
quarter marked a turning point, particularly in the retail segment at BCP, which rode favorable macroeconomic tailwinds to rebound. QoQ, this evolution was driven primarily by i) growth in short-term loans in Corporate Banking, ii) an
increase in loan disbursements through Government Programs and negotiable invoices in SME-Business, and iii) a rebound in disbursements through Mortgage. This growth was partially offset by a decline in balances in Middle Market Banking
and Mibanco.
YoY, total loans in average daily balances dropped 0.5% (-0.5% FX Neutral). This evolution was mainly
attributable to i) stricter lending policies at Mibanco, ii) growth in short-term loan amortizations in Middle Market banking and iii) a decrease in disbursements of long-term loans in SME-Pyme. The interannual decline was partially
offset by growth in Corporate Banking, Mortgage and SME-Business, which was driven by the same factors outlined in the QoQ analysis. On a Full-Year basis, loans in ADB dropped 1.1%, driven primarily by Mibanco and Middle Market Banking.
If we exclude the impact of Government Program loans, loans in average daily balances rose 0.2%.
|
|
Total Loans
|
|
As of
|
Year
|
Volume change
|
% change
|
% Part. in total loans
|
||||||||||
|
S/ millions
|
Dec 23
|
Sep 24
|
Dec 24
|
2023
|
2024
|
QoQ
|
YoY
|
Year
|
QoQ
|
YoY
|
Year
|
Dec 23
|
Sep 24
|
Dec 24
|
2023
|
2024
|
|
BCP Stand-alone
|
116,011
|
115,569
|
116,631
|
116,585
|
115,758
|
1,062
|
621
|
-827
|
0.9%
|
0.5%
|
-0.7%
|
81.4%
|
82.0%
|
82.2%
|
81.5%
|
81.8%
|
|
Wholesale Banking
|
52,476
|
52,257
|
52,672
|
53,339
|
52,338
|
416
|
197
|
-1,001
|
0.8%
|
0.4%
|
-1.9%
|
36.8%
|
37.1%
|
37.1%
|
37.3%
|
37.0%
|
|
Corporate
|
30,559
|
31,108
|
31,968
|
31,626
|
31,158
|
859
|
1,408
|
-468
|
2.8%
|
4.6%
|
-1.5%
|
21.4%
|
22.1%
|
22.5%
|
22.1%
|
22.0%
|
|
Middle - Market
|
21,916
|
21,148
|
20,705
|
21,713
|
21,180
|
-443
|
-1,212
|
-533
|
-2.1%
|
-5.5%
|
-2.5%
|
15.4%
|
15.0%
|
14.6%
|
15.2%
|
15.0%
|
|
Retail Banking
|
63,535
|
63,312
|
63,959
|
63,246
|
63,420
|
647
|
424
|
174
|
1.0%
|
0.7%
|
0.3%
|
44.6%
|
44.9%
|
45.1%
|
44.2%
|
44.8%
|
|
SME - Business
|
7,168
|
7,356
|
7,629
|
7,441
|
7,245
|
272
|
461
|
-196
|
3.7%
|
6.4%
|
-2.6%
|
5.0%
|
5.2%
|
5.4%
|
5.2%
|
5.1%
|
|
SME - Pyme
|
16,751
|
16,184
|
16,251
|
16,698
|
16,311
|
66
|
-500
|
-388
|
0.4%
|
-3.0%
|
-2.3%
|
11.7%
|
11.5%
|
11.5%
|
11.7%
|
11.5%
|
|
Mortgage
|
21,061
|
21,606
|
21,868
|
20,626
|
21,535
|
262
|
807
|
910
|
1.2%
|
3.8%
|
4.4%
|
14.8%
|
15.3%
|
15.4%
|
14.4%
|
15.2%
|
|
Consumer
|
12,604
|
12,319
|
12,358
|
12,753
|
12,410
|
39
|
-246
|
-344
|
0.3%
|
-2.0%
|
-2.7%
|
8.8%
|
8.7%
|
8.7%
|
8.9%
|
8.8%
|
|
Credit Card
|
5,951
|
5,847
|
5,853
|
5,728
|
5,920
|
6
|
-98
|
192
|
0.1%
|
-1.6%
|
3.4%
|
4.2%
|
4.1%
|
4.1%
|
4.0%
|
4.2%
|
|
Mibanco
|
13,665
|
12,199
|
12,057
|
14,029
|
12,579
|
-142
|
-1,608
|
-1,450
|
-1.2%
|
-11.8%
|
-10.3%
|
9.6%
|
8.7%
|
8.5%
|
9.8%
|
8.9%
|
|
Mibanco Colombia
|
1,667
|
1,721
|
1,715
|
1,454
|
1,728
|
-6
|
48
|
274
|
-0.4%
|
2.9%
|
18.8%
|
1.2%
|
1.2%
|
1.2%
|
1.0%
|
1.2%
|
|
Bolivia
|
9,186
|
9,555
|
9,628
|
8,982
|
9,547
|
73
|
442
|
565
|
0.8%
|
4.8%
|
6.3%
|
6.4%
|
6.8%
|
6.8%
|
6.3%
|
6.7%
|
|
ASB
|
2,036
|
1,867
|
1,807
|
2,080
|
1,893
|
-60
|
-229
|
-187
|
-3.2%
|
-11.3%
|
-9.0%
|
1.4%
|
1.3%
|
1.3%
|
1.5%
|
1.3%
|
|
BAP's total loans
|
142,565
|
140,910
|
141,838
|
143,130
|
141,505
|
928
|
-727
|
-1,625
|
0.7%
|
-0.5%
|
-1.1%
|
100.0%
|
100.0%
|
100.0%
|
100.0%
|
100.0%
|
|
|
Corporate Banking, due to an increase in disbursements of short-term loans, mainly in the mining and energy
sectors.
|
|
|
SME-Business, due to growth in loan disbursements through Government Programs (Impulso MyPerú) and negotiable
invoices.
|
|
|
Mortgage, due to a rebound in disbursements this quarter, which was driven by economic reactivation and an
uptick in the demand for loans.
|
|
|
Middle Market Banking, due primarily to growth in short-term loan amortizations.
|
|
|
Mibanco, given that growth in small-ticket, higher- yield loans was insufficient to offset the decline in
higher-ticket loans. It is important to note that this
|
|
|
Mibanco, after stricter lending policies went into effect since the end of 2Q24, as the industry continues to
adopt a prudent approach to origination.
|
|
|
Middle Market Banking, due to the same dynamics as those seen QoQ.
|
|
|
SME-Pyme, due to a drop in long-term loan disbursements.
|
|
|
Corporate Banking, Mortgage and SME-Business due to the same dynamics reported in the QoQ analysis.
|
|
|
|
| |
Earnings Release 4Q / 2024
|
Analysis of 4Q24 Consolidated Results
|
|
|
|
Total Loans
|
Local Currency (LC) - S/ millions
|
% change
|
Foreign Currency (FC) - US$ millions
|
% change
|
% part. by currency
|
|||||||
|
Total
|
|
Total
|
Dec 24
|
|||||||||
|
S/ millions
|
Dec 23
|
Sep 24
|
Dec 24
|
QoQ
|
YoY
|
Dec 23
|
Sep 24
|
Dec 24
|
QoQ
|
YoY
|
LC
|
FC
|
|
BCP Stand-alone
|
79,425
|
78,619
|
79,735
|
1.4%
|
0.4%
|
9,728
|
9,924
|
9,818
|
-1.1%
|
0.9%
|
68.4%
|
31.6%
|
|
Wholesale Banking
|
23,454
|
22,748
|
23,500
|
3.3%
|
0.2%
|
7,717
|
7,925
|
7,763
|
-2.0%
|
0.6%
|
44.6%
|
55.4%
|
|
Corporate
|
14,017
|
13,916
|
14,540
|
4.5%
|
3.7%
|
4,398
|
4,618
|
4,638
|
0.4%
|
5.4%
|
45.5%
|
54.5%
|
|
Middle-Market
|
9,436
|
8,833
|
8,960
|
1.4%
|
-5.0%
|
3,318
|
3,308
|
3,125
|
-5.5%
|
-5.8%
|
43.3%
|
56.7%
|
|
Retail Banking
|
55,972
|
55,870
|
56,235
|
0.7%
|
0.5%
|
2,011
|
1,999
|
2,055
|
2.8%
|
2.2%
|
87.9%
|
12.1%
|
|
SME - Business
|
4,242
|
4,581
|
4,721
|
3.1%
|
11.3%
|
778
|
745
|
774
|
3.8%
|
-0.5%
|
61.9%
|
38.1%
|
|
SME - Pyme
|
16,589
|
16,023
|
16,095
|
0.4%
|
-3.0%
|
43
|
43
|
42
|
-4.2%
|
-3.8%
|
99.0%
|
1.0%
|
|
Mortgage
|
19,095
|
19,690
|
19,953
|
1.3%
|
4.5%
|
523
|
515
|
510
|
-0.9%
|
-2.5%
|
91.2%
|
8.8%
|
|
Consumer
|
11,075
|
10,742
|
10,679
|
-0.6%
|
-3.6%
|
407
|
423
|
447
|
5.5%
|
9.9%
|
86.4%
|
13.6%
|
|
Credit Card
|
4,971
|
4,834
|
4,788
|
-1.0%
|
-3.7%
|
260
|
272
|
283
|
4.2%
|
8.8%
|
81.8%
|
18.2%
|
|
Mibanco
|
13,181
|
12,186
|
12,045
|
-1.2%
|
-8.6%
|
129
|
4
|
3
|
-8.1%
|
-97.5%
|
99.9%
|
0.1%
|
|
Mibanco Colombia
|
-
|
-
|
-
|
-
|
-
|
443
|
462
|
456
|
-1.3%
|
2.9%
|
-
|
100.0%
|
|
Bolivia
|
-
|
-
|
-
|
-
|
-
|
2,443
|
2,566
|
2,562
|
-0.2%
|
4.9%
|
-
|
100.0%
|
|
ASB Bank Corp.
|
-
|
-
|
-
|
-
|
-
|
541
|
501
|
481
|
-4.1%
|
-11.2%
|
-
|
100.0%
|
|
Total loans
|
92,606
|
90,805
|
91,779
|
1.1%
|
-0.9%
|
13,284
|
13,457
|
13,321
|
-1.0%
|
0.3%
|
64.7%
|
35.3%
|
|
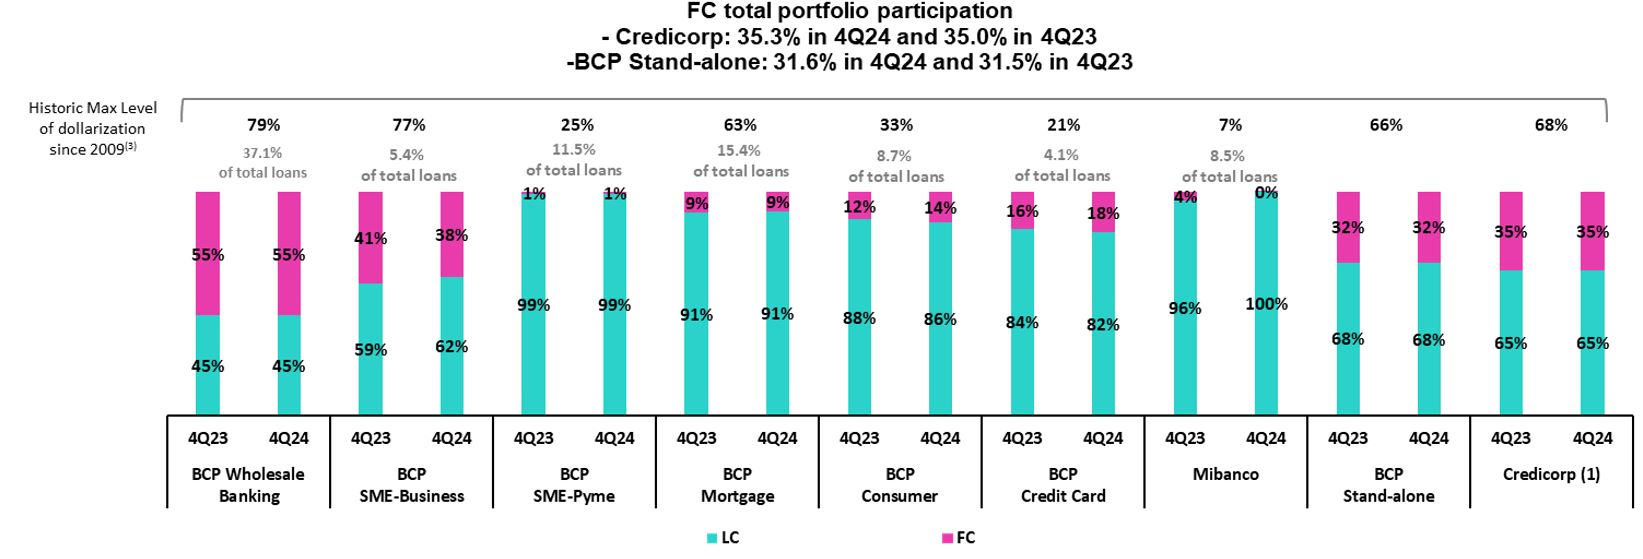
Measured in Average Daily Balances.
(1) Includes Special accounts, and other banking.
(2) Internal Management Figures.
Largest contraction in volumes
Highest growth in volumes
|
|
|
| |
Earnings Release 4Q / 2024
|
Analysis of 4Q24 Consolidated Results
|
|
01. Loan Portfolio
|
|
(1)
|
The FC share of Credicorp’s loan portfolio is calculated including BCP Bolivia and ASB Bank Corp., however the chart shows only the loan books of BCP Stand-alone and
Mibanco.
|
|
(2)
|
The year with the historic maximum level of dollarization for Wholesale Banking was 2012, for Mibanco was 2016, for Credit Card was in 2021 and for the rest of segments was
2009.
|
|
| |
Earnings Release 4Q / 2024
|
Analysis of 4Q24 Consolidated Results
|
| 02 | Deposits |
|
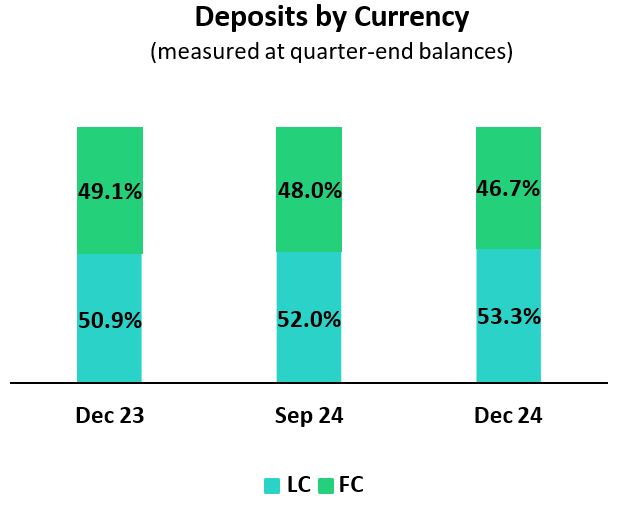
Total deposits continued to grow this quarter, closing the year with a record high-balance. QoQ, growth was
primarily driven by a 9.7% increase in Savings Deposits, which was mainly attributable to payments of statutory bonuses in December, and secondarily by a 6.4% increase in Time Deposits, which was driven by the recurrent capture of funds,
mainly in wholesale clients.
YoY, the deposit balance grew fueled by low-cost deposits (+11.7%), and by Savings Deposits in particular,
which rose 14.1% thanks to improvements in our transactional offering. These improvements have enabled us to attract inflows related to pension funds withdrawals.
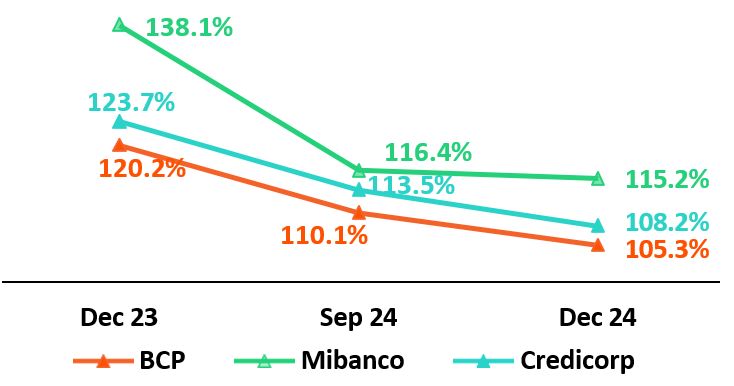
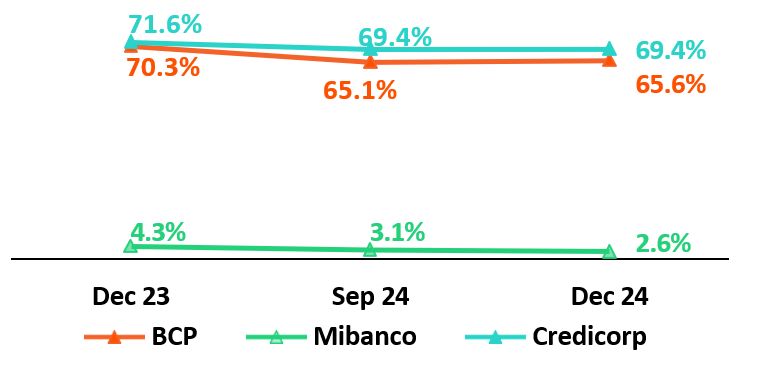
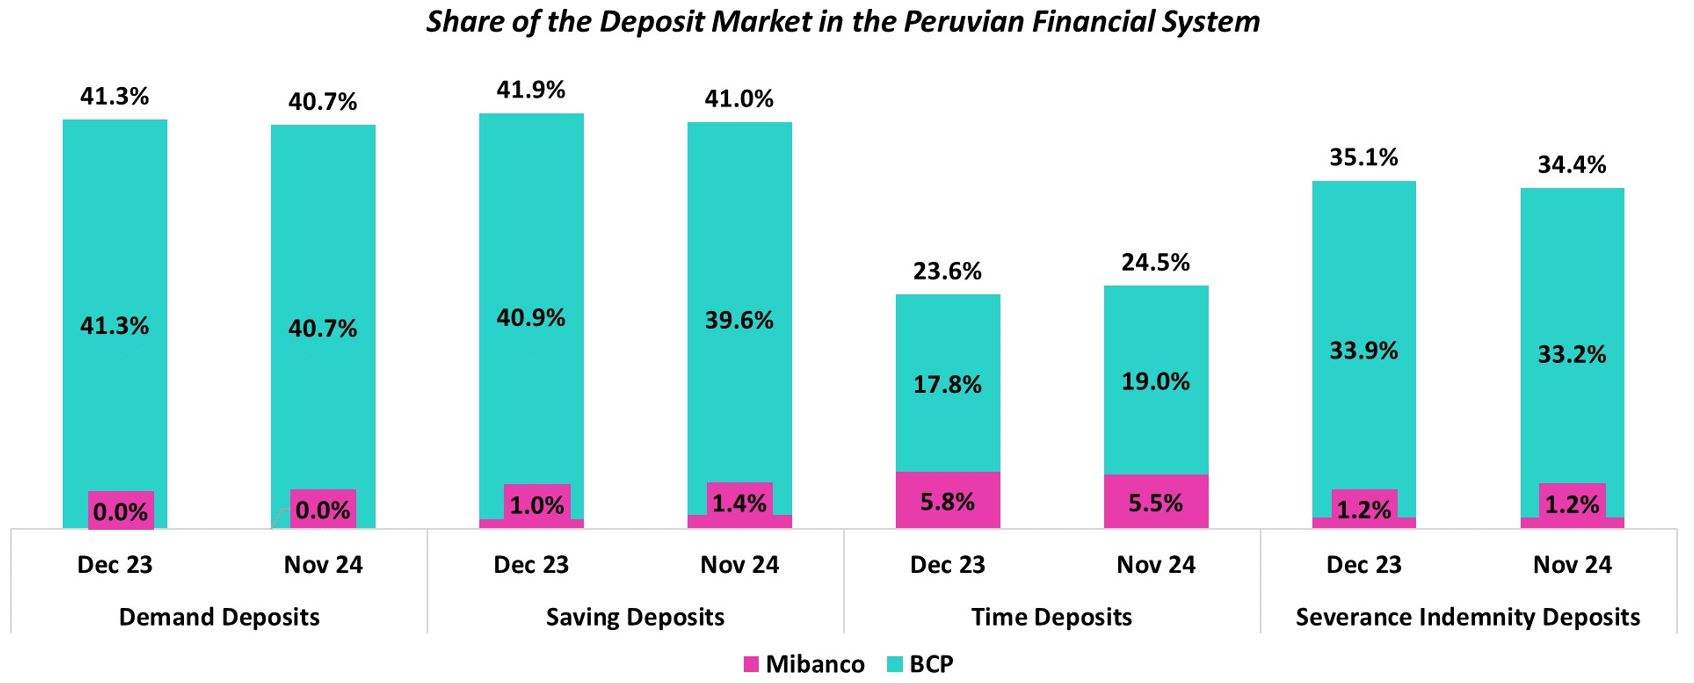
At the end of 4Q24, 69.4% of total deposits were low-cost (Demand and Savings). Credicorp continued to lead the
low-cost deposit market with a 40.9% share at the end of November 2024. This evolution represents an important competitive advantage to a context marked by an easing cycle in interest rates.
|
|
Deposits
|
As of
|
% change
|
Currency
|
||||
|
S/000
|
Dec 23
|
Sep 24
|
Dec 24
|
QoQ
|
YoY
|
LC
|
FC
|
|
Demand deposits
|
48,229,323
|
53,149,144
|
52,590,952
|
-1.1%
|
9.0%
|
49.4%
|
50.6%
|
|
Saving deposits
|
52,375,813
|
54,474,960
|
59,757,825
|
9.7%
|
14.1%
|
61.3%
|
38.7%
|
|
Time deposits
|
42,484,664
|
42,514,849
|
45,217,785
|
6.4%
|
6.4%
|
46.4%
|
53.6%
|
|
Severance indemnity deposits
|
3,185,603
|
2,989,705
|
2,996,020
|
0.2%
|
-6.0%
|
74.4%
|
25.6%
|
|
Interest payable
|
1,429,591
|
1,306,793
|
1,279,484
|
-2.1%
|
-10.5%
|
20.5%
|
79.5%
|
|
Low-cost deposits (1)
|
100,605,136
|
107,624,104
|
112,348,777
|
4.4%
|
11.7%
|
55.7%
|
44.3%
|
|
Deposits and obligations
|
147,704,994
|
154,435,451
|
161,842,066
|
4.8%
|
9.6%
|
53.2%
|
46.8%
|
|
(1)
|
Includes Demand Deposits and Saving Deposits
|
|
•
|
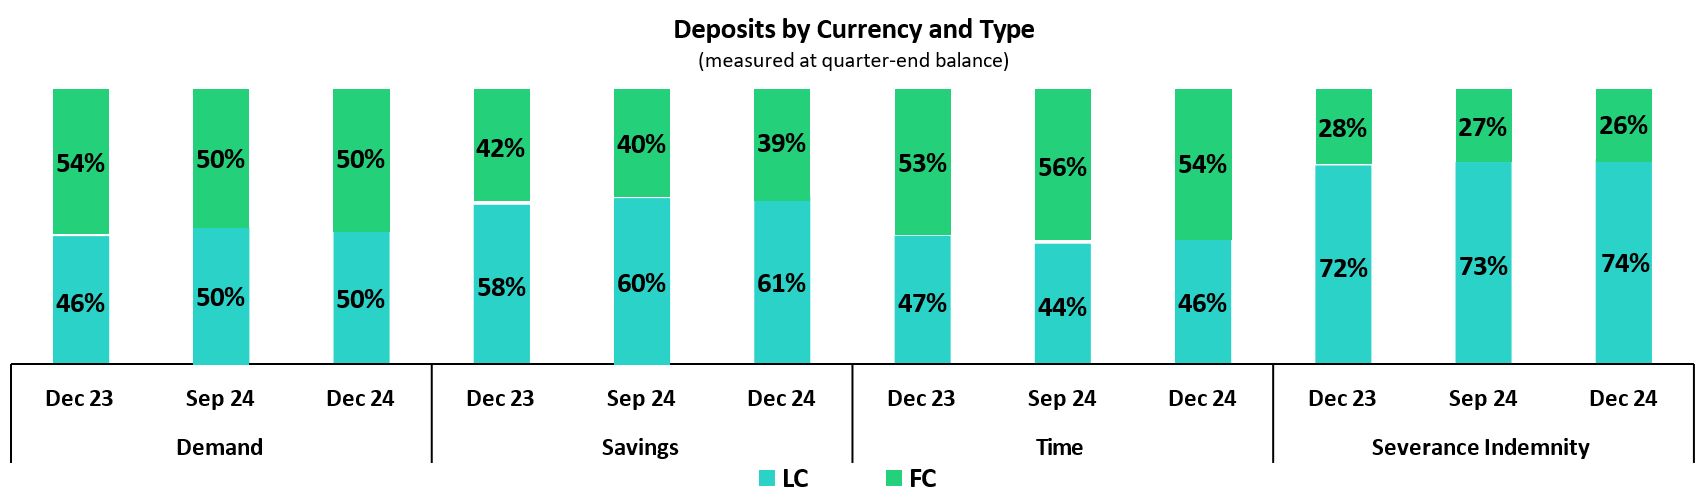
Growth of 9.7% (+9.1% FX neutral) in the Savings Deposit balance, which was primarily fueled by LC deposits and to
a lesser extent by FC deposits, both at BCP Stand-alone and associated with liquidity from statutory bonuses and campaigns to capture more deposits.
|
|
•
|
An increase of 6.4% (+5.5% FX neutral) in the Time Deposit balance, which was mainly driven by an uptick in LC
volumes due to recurrent captures of wholesale funds and migration from Low Cost Deposits as clients looked to leverage, still relatively high rates.
|
|
•
|
A 14.1% (+13.5% FX neutral) increase in Savings Deposits, driven primarily by growth in LC deposits at BCP
Stand-alone, primarily attributable to improvements in our transactional offerings, which has enabled us to attract inflows related to pension funds withdrawals and secondarily by the same dynamics seen QoQ.
|
|
•
|
A 9.0% (+8.2% FX neutral) rise in the Demand Deposits balance, which was driven by growth in the LC balance at BCP
Stand- alone. This expansion was primarily attributable to growth in the balances of the individuals and small business banking segments, which was driven by the enhancements in our transactional offering and by disbursements of
government program loans, respectively.
|
|
•
|
Growth of 6.4% (+5.6% FX neutral) in the Time Deposits balance, which was driven primarily by BCP Stand-alone.
This expansion was mainly attributable to an uptick in the LC balance, which was fueled by corporate clients via the same dynamics seen QoQ, and secondarily, by an increase in the FC balance via recurrent captures of deposits.
|
|
| |
Earnings Release 4Q / 2024
|
Analysis of 4Q24 Consolidated Results
|
|
02. Deposits
|
|
|
|
|
|
|
|
| |
Earnings Release 4Q / 2024
|
Analysis of 4Q24 Consolidated Results
|
|
02. Deposits
|
|
| |
Earnings Release 4Q / 2024
|
Analysis of 4Q24 Consolidated Results
|
| 03 | Interest-earning Assets (IEA) and Funding |
|
QoQ, IEA increased 2.7%. This growth was driven by an increase in wholesale loans and by a higher balance of Cash and due
from banks. Funding rose 3.9%, fueled mainly by growth in Deposits. This uptick was concentrated in low-cost deposits,
underscoring the strength of BCP’s transactional offering. Growth in funding through deposits was partially offset by a drop in Due to banks and correspondents, which registered expirations over the period.
YoY, IEA advanced (+7.2%), fueled primarily by growth in the balance for Cash and due from banks and
secondarily by an uptick in the balance for Investments, which rose on the back of higher sovereign bond holdings. Lastly, funding rose 7.7%, driven mainly by growth in Deposits and to a lesser extent by an increase in the balance of Bonds
and notes issued.
|
||||
|
3.1.
|
IEA
|
|
Interest Earning Assets
|
|
As of
|
% change
|
||
|
S/000
|
Dec 23
|
Sep 24
|
Dec 24
|
QoQ
|
YoY
|
|
Cash and due from banks
|
25,978,577
|
37,007,966
|
40,119,937
|
8.4%
|
54.4%
|
|
Total investments
|
52,215,528
|
53,328,873
|
53,825,858
|
0.9%
|
3.1%
|
|
Cash collateral, reverse repurchase agreements and securities borrowing
|
1,410,647
|
1,419,305
|
1,033,177
|
-27.2%
|
-26.8%
|
|
Total loans
|
144,976,051
|
142,568,785
|
145,732,273
|
2.2%
|
0.5%
|
|
Total interest earning assets
|
224,580,803
|
234,324,929
|
240,711,245
|
2.7%
|
7.2%
|
|
3.2.
|
Funding
|
|
Funding
|
|
As of
|
% change
|
||
|
S/000
|
Dec 23
|
Sep 24
|
Dec 24
|
QoQ
|
YoY
|
|
Deposits and obligations
|
147,704,994
|
154,435,451
|
161,842,066
|
4.8%
|
9.6%
|
|
Due to banks and correspondents
|
12,278,681
|
12,704,234
|
10,754,385
|
-15.3%
|
-12.4%
|
|
BCRP instruments
|
7,461,674
|
4,788,939
|
6,646,830
|
38.8%
|
-10.9%
|
|
Repurchase agreements with clients and third parties
|
2,706,753
|
2,594,165
|
2,413,880
|
-6.9%
|
-10.8%
|
|
Bonds and notes issued
|
14,594,785
|
16,952,011
|
17,268,443
|
1.9%
|
18.3%
|
|
Total funding
|
184,746,887
|
191,474,800
|
198,925,604
|
3.9%
|
7.7%
|
|
| |
Earnings Release 4Q / 2024
|
Analysis of 4Q24 Consolidated Results
|
| 04 | Net Interest Income (NII) |
|
|
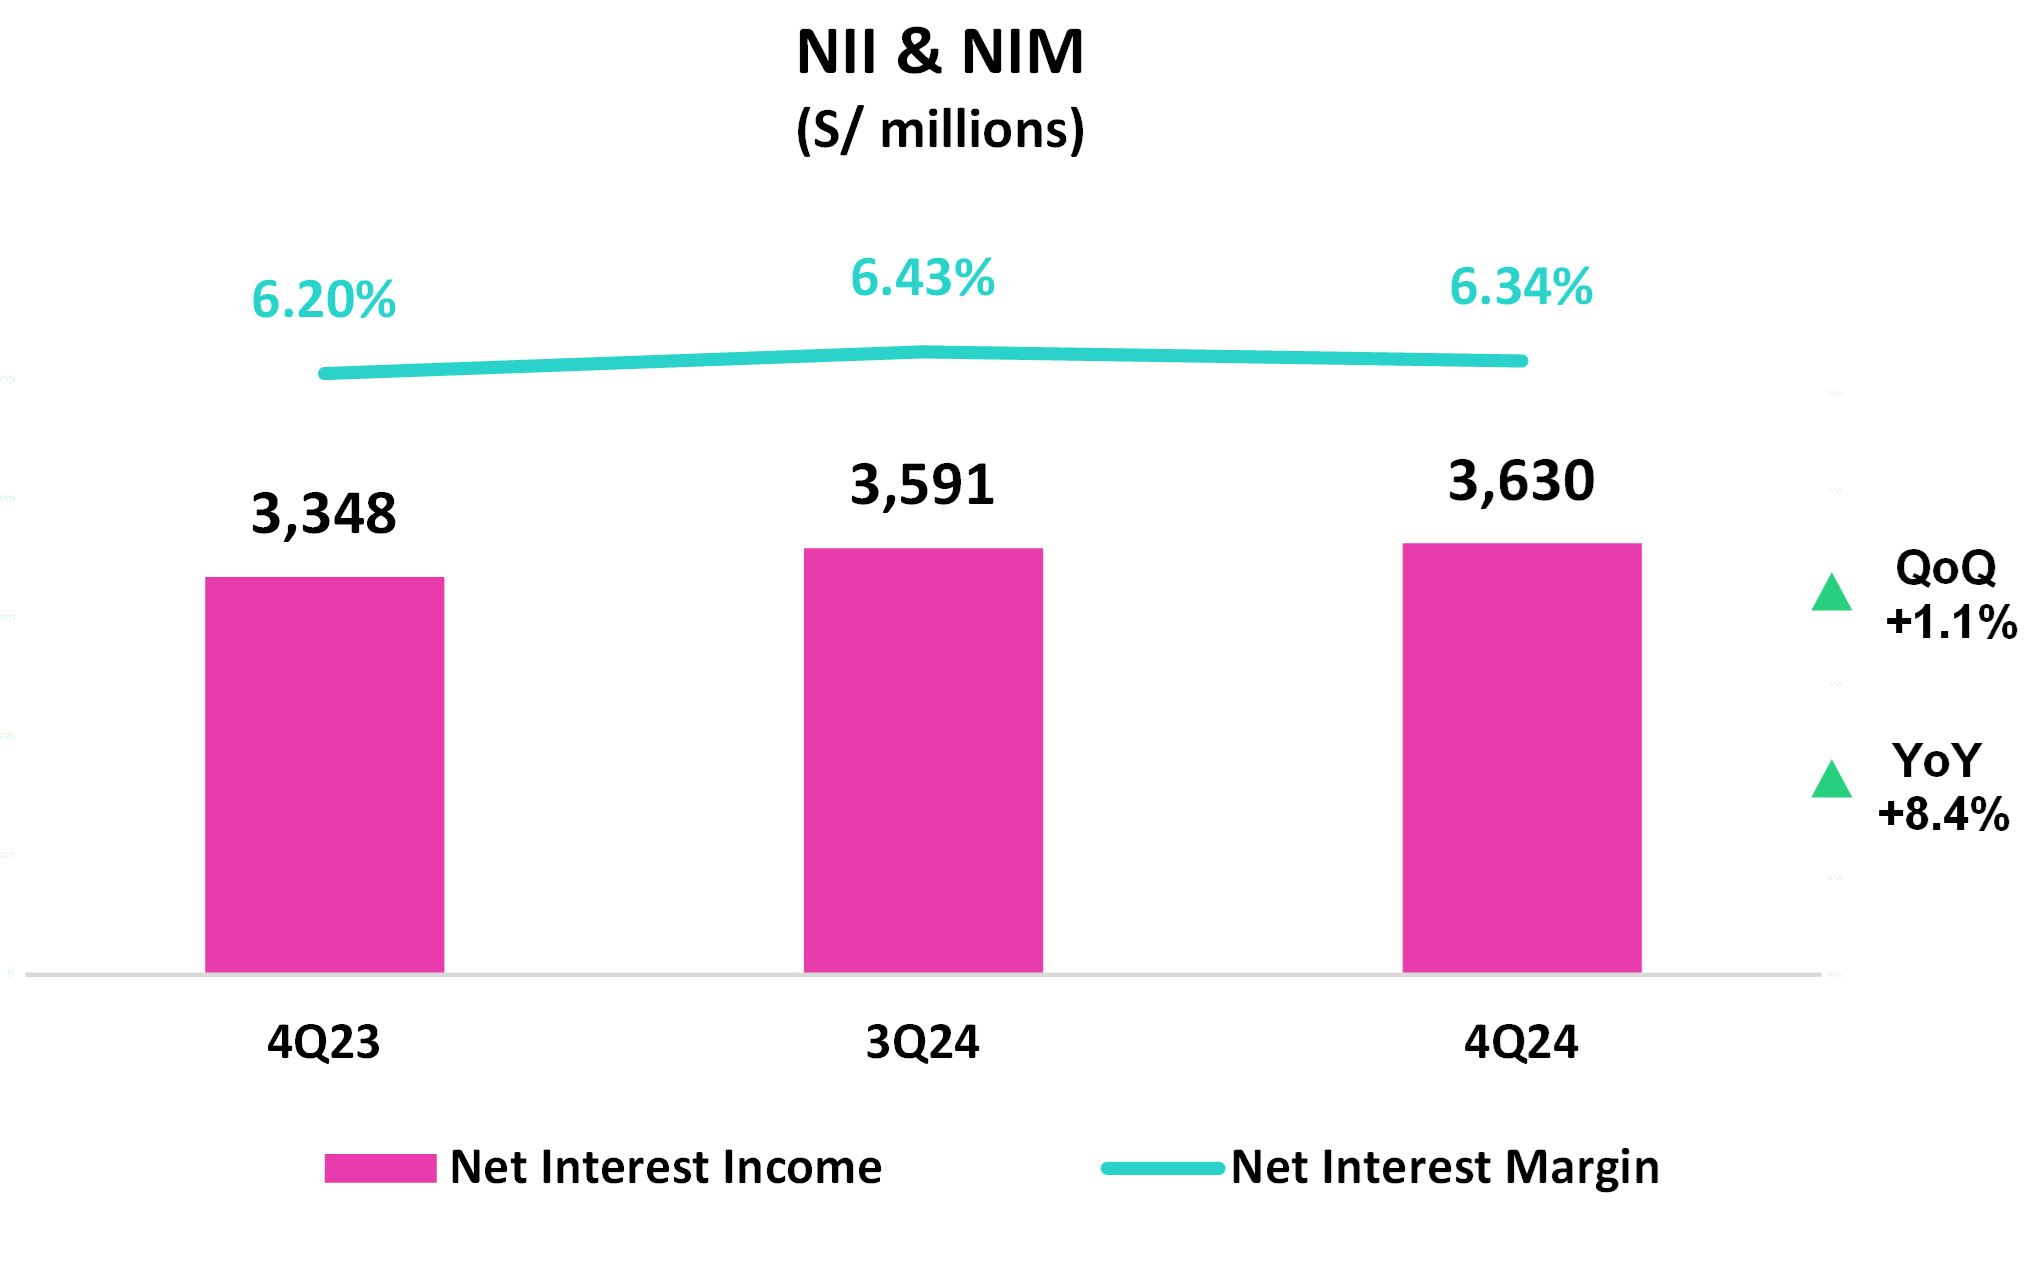
In 4Q24, Net Interest Income (NII) rose 1.1% QoQ, driven by a drop in Interest and similar expenses. These
reductions were fueled by a decrease in interest on deposits, in a juncture marked by lower market rates and an uptick in low-cost deposits’ share of the mix. Interest and similar income increased, spurred mainly by growth in
interest on deposits with banks.
YoY, NII grew 8.4% on the back of growth in Interest and similar income, which rose primarily due to an increase
in interest on deposits with banks and secondarily to an increase in interest on loans, which reflects advances in pricing management in key sectors at BCP. Interest and similar expenses also contributed to NII’s expansion, via the
same drivers mentioned in the QoQ analysis.
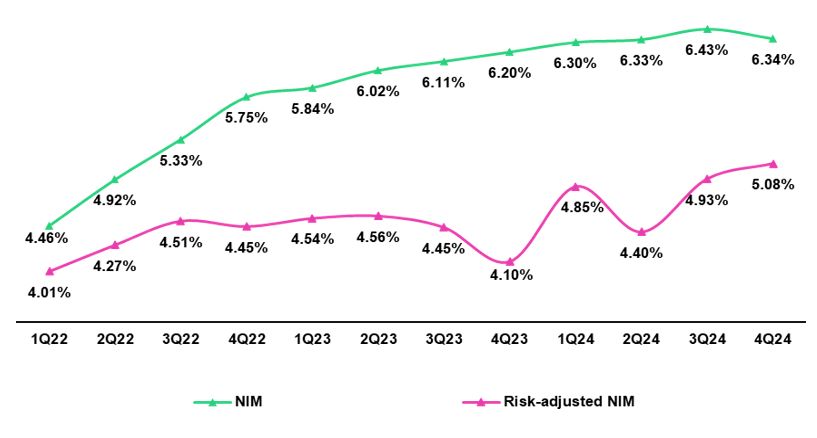
NIM dropped 9 bps QoQ to stand at 6.34%. Notwithstanding, full-year growth reported a 29-bps increase in 2024,
bolstered by a shift in the composition of the loan portfolio towards retail loans. Lastly, risk-adjusted NIM rose 15 bps QoQ and 39 bps for the full-year in 2024. FY24 risk-adjusted NIM stood at 4.8% which represents a record high1 on the back of improvements in the risk profile of the loan portfolio.
|
|
Net interest income
|
Quarter
|
% change
|
Up to
|
% Change
|
||||
|
S/000
|
4Q23
|
3Q24
|
4Q24
|
QoQ
|
YoY
|
Dec 23
|
Dec 24
|
Dec 24 / Dec 23
|
|
Interest Income
|
4,870,042
|
4,995,971
|
5,012,121
|
0.3%
|
2.9%
|
18,798,495
|
19,869,256
|
5.7%
|
|
Interest Expense
|
(1,522,358)
|
(1,405,221)
|
(1,382,327)
|
-1.6%
|
-9.2%
|
(5,860,523)
|
(5,754,125)
|
-1.8%
|
|
Interest Expense (excluding Net Insurance Financial Expenses)
|
(1,402,925)
|
(1,276,643)
|
(1,250,239)
|
-2.1%
|
-10.9%
|
(5,393,709)
|
(5,246,769)
|
-2.7%
|
|
Net Insurance Financial Expenses
|
(119,433)
|
(128,578)
|
(132,088)
|
2.7%
|
10.6%
|
(466,814)
|
(507,356)
|
8.7%
|
|
Net Interest Income
|
3,347,684
|
3,590,750
|
3,629,794
|
1.1%
|
8.4%
|
12,937,972
|
14,115,131
|
9.1%
|
|
Balances
|
||||||||
|
Average Interest Earning Assets (IEA)
|
223,624,217
|
231,316,507
|
237,518,087
|
2.7%
|
6.2%
|
223,318,737
|
232,646,024
|
4.2%
|
|
Average Funding
|
185,182,243
|
190,855,164
|
195,200,202
|
2.3%
|
5.4%
|
185,339,502
|
191,836,246
|
3.5%
|
|
Yields
|
||||||||
|
Yield on IEAs
|
8.71%
|
8.64%
|
8.44%
|
-20 bps
|
-27 bps
|
8.42%
|
8.54%
|
12 bps
|
|
Cost of Funds(1)
|
3.03%
|
2.68%
|
2.56%
|
-12 bps
|
-47 bps
|
2.91%
|
2.74%
|
-17 bps
|
|
Net Interest Margin (NIM)(1)
|
6.20%
|
6.43%
|
6.34%
|
-9 bps
|
14 bps
|
6.00%
|
6.29%
|
29 bps
|
|
Risk-Adjusted Net Interest Margin(1)
|
4.10%
|
4.93%
|
5.08%
|
15 bps
|
98 bps
|
4.38%
|
4.77%
|
39 bps
|
|
Peru's Reference Rate
|
6.75%
|
5.25%
|
5.00%
|
-25 bps
|
-175 bps
|
6.75%
|
5.00%
|
-175 bps
|
|
FED funds rate
|
5.50%
|
5.00%
|
4.50%
|
-50 bps
|
-100 bps
|
5.50%
|
4.50%
|
-100 bps
|
|
1
|
Since the implementation of IFRS 9 in 2018.
|
|
| |
Earnings Release 4Q / 2024
|
Analysis of 4Q24 Consolidated Results
|
|
04. Net Interest Income (NII)
|
|
|
|
Interest Income / IEA
|
4Q23
|
3Q24
|
4Q24
|
Dec 23
|
Dec 24
|
|||||||||||
|
S/ millions
|
Average
|
Average
|
Average
|
Average
|
Average
|
|||||||||||
|
Balance
|
Income
|
Yields
|
Balance
|
Income
|
Yields
|
Balance
|
Income
|
Yields
|
Balance
|
Income
|
Yields
|
Balance
|
Income
|
Yields
|
||
|
Cash and equivalents
|
25,443
|
279
|
4.4%
|
32,083
|
365
|
4.6%
|
38,564
|
386
|
4.0%
|
26,438
|
1,133
|
4.3%
|
33,050
|
1,406
|
4.3%
|
|
|
Other IEA
|
1,462
|
28
|
7.7%
|
1,598
|
26
|
6.5%
|
1,227
|
18
|
5.9%
|
1,257
|
85
|
6.8%
|
1,222
|
100
|
8.2%
|
|
|
Investments
|
51,666
|
656
|
5.1%
|
52,877
|
681
|
5.2%
|
53,578
|
667
|
5.0%
|
48,823
|
2,536
|
5.2%
|
53,021
|
2,710
|
5.1%
|
|
|
Loans
|
145,053
|
3,908
|
10.8%
|
144,757
|
3,924
|
10.8%
|
144,150
|
3,940
|
10.9%
|
146,801
|
15,045
|
10.2%
|
145,354
|
15,655
|
10.8%
|
|
|
Total IEA
|
223,624
|
4,871
|
8.7%
|
231,315
|
4,996
|
8.6%
|
237,519
|
5,011
|
8.4%
|
223,319
|
18,799
|
8.4%
|
232,647
|
19,871
|
8.5%
|
|
|
IEA (LC)
|
57.6%
|
70.5%
|
10.7%
|
55.7%
|
68.8%
|
10.7%
|
54.7%
|
68.8%
|
10.6%
|
57.4%
|
71.1%
|
10.4%
|
56.2%
|
69.2%
|
10.5%
|
|
|
IEA (FC)
|
42.4%
|
29.5%
|
6.1%
|
44.3%
|
31.2%
|
6.1%
|
45.3%
|
31.2%
|
5.8%
|
42.6%
|
28.9%
|
5.7%
|
43.8%
|
30.8%
|
6.0%
|
|
Interest Expense / Funding
|
4Q23
|
3Q24
|
|
4Q24 |
Dec 23
|
Dec 24
|
||||||||||
|
S/ millions
|
Average
|
Average
|
Average
|
Average
|
Average
|
|||||||||||
|
Balance
|
Expense
|
Yields
|
Balance
|
Expense
|
Yields
|
Balance
|
Expense
|
Yields
|
Balance
|
Expense
|
Yields
|
Balance
|
Expense
|
Yields
|
||
|
Deposits
|
148,088
|
827
|
2.2%
|
153,203
|
678
|
1.8%
|
158,139
|
655
|
1.7%
|
147,363
|
3,142
|
2.1%
|
154,773
|
2,850
|
1.8%
|
|
|
BCRP + Due to Banks
|
19,925
|
297
|
6.0%
|
17,828
|
262
|
5.9%
|
17,447
|
287
|
6.6%
|
19,987
|
1,159
|
5.8%
|
18,571
|
1,081
|
5.8%
|
|
|
Bonds and Notes
|
14,755
|
153
|
4.1%
|
17,453
|
201
|
4.6%
|
17,110
|
201
|
4.7%
|
15,801
|
634
|
4.0%
|
15,931
|
800
|
5.0%
|
|
|
Others
|
2,415
|
245
|
40.6%
|
2,371
|
264
|
44.5%
|
2,504
|
239
|
38.2%
|
2,188
|
926
|
42.3%
|
2,561
|
1,023
|
39.9%
|
|
|
Total Funding
|
185,183
|
1,522
|
3.3%
|
190,855
|
1,405
|
2.9%
|
195,200
|
1,382
|
2.8%
|
185,339
|
5,861
|
3.2%
|
191,836
|
5,754
|
3.0%
|
|
|
Funding (LC)
|
50.2%
|
55.9%
|
3.7%
|
49.3%
|
48.5%
|
2.9%
|
49.6%
|
49.8%
|
2.8%
|
50.1%
|
58.1%
|
3.7%
|
50.1%
|
50.5%
|
3.0%
|
|
|
Funding (FC)
|
49.8%
|
44.1%
|
2.9%
|
50.7%
|
51.5%
|
3.0%
|
50.4%
|
50.2%
|
2.8%
|
49.9%
|
41.9%
|
2.7%
|
49.9%
|
49.5%
|
3.0%
|
|
NIM
|
223,624
|
3,349
|
6.0%
|
231,315
|
3,591
|
6.2%
|
237,519
|
3,629
|
6.1%
|
223,319
|
12,938
|
5.8%
|
232,647
|
14,117
|
6.1%
|
|
|
NIM (LC)
|
57.6%
|
77.2%
|
8.0%
|
55.7%
|
76.8%
|
8.6%
|
54.7%
|
76.1%
|
8.5%
|
57.4%
|
77.0%
|
7.8%
|
56.2%
|
76.9%
|
8.3%
|
|
|
NIM (FC)
|
42.4%
|
22.8%
|
3.2%
|
44.3%
|
23.2%
|
3.3%
|
45.3%
|
23.9%
|
3.2%
|
42.6%
|
23.0%
|
3.1%
|
43.8%
|
23.1%
|
3.2%
|
|
(1)
|
Unlike the NIM figure calculated according to the formula in Appendix 12.7, the NIM presented in this table includes “Financial Expense associated with the insurance and reinsurance activity, net”.
|
|
| |
Earnings Release 4Q / 2024
|
Analysis of 4Q24 Consolidated Results
|
|
04. Net Interest Income (NII)
|
|
| |
Earnings Release 4Q / 2024
|
Analysis of 4Q24 Consolidated Results
|
| 05 | Portfolio Quality and Provisions |
|
This quarter, NPLs continued to drop after reaching a turning point in 3Q24, particularly in the segments most
impacted by the recent credit cycle: the Individuals and the SME-Pyme portfolio at BCP Stand-alone, and the loan portfolio at Mibanco. This is the result of successful risk management measures at BCP and Mibanco. At BCP, portfolio
quality metrics improved due to risk management measures such as adjusting credit guidelines in high-risk segments, shoring up credit processes and calibrating specific models to better predict losses; while at Mibanco, portfolio
quality metrics improved due to the positive impact of stricter origination policies, improvements in debt collection management and the debt relief facilities rolled out as of 2Q24.
QoQ, the decline in the NPL portfolio at BCP was fueled primarily by a reduction in overdue loans in Small
Businesses and debt cancellations in Wholesale. At Mibanco, the reduction in NPLs was attributable to a drop in overdue loans. As a result, the NPL ratio dropped 60 bps and 63 pbs QoQ and YoY, respectively, to stand at 5.3%. On the
other hand, provisions fell this quarter, mainly on the back of BCP, which reported an improvement in payment performance in SME-Pyme and Mortgage, followed by the same dynamic at Mibanco. This evolution was partially offset by an
increase in provisions for Consumer and Credit Cards, due to risk model calibrations. Despite higher provisions, the underlying risk improved for both segments. In this context, the cost of risk dropped 34 bps and 118 bps QoQ and
YoY, respectively, to stand at 2.1%.
|
||||
| 5.1 Portfolio Quality | ||||
|
Loan Portfolio quality and Delinquency ratios
|
As of
|
% change
|
|||
|
S/000
|
Dec 23
|
Sep 24
|
Dec 24
|
QoQ
|
YoY
|
|
Total loans (Quarter-end balance)
|
144,976,051
|
142,568,785
|
145,732,273
|
2.2%
|
0.5%
|
|
Write-offs
|
879,401
|
923,946
|
896,714
|
-2.9%
|
2.0%
|
|
Internal overdue loans (IOLs)
|
6,126,487
|
6,026,341
|
5,423,212
|
-10.0%
|
-11.5%
|
|
Internal overdue loans over 90-days
|
4,673,564
|
4,851,591
|
4,383,795
|
-9.6%
|
-6.2%
|
|
Refinanced loans
|
2,406,058
|
2,333,814
|
2,239,445
|
-4.0%
|
-6.9%
|
|
Non-performing loans (NPLs)
|
8,532,545
|
8,360,155
|
7,662,657
|
-8.3%
|
-10.2%
|
|
IOL ratio
|
4.2%
|
4.2%
|
3.7%
|
-51 bps
|
-51 bps
|
|
IOL over 90-days ratio
|
3.2%
|
3.4%
|
3.0%
|
-39 bps
|
-19 bps
|
|
NPL ratio
|
5.9%
|
5.9%
|
5.3%
|
-60 bps
|
-63 bps
|
|
| |
Earnings Release 4Q / 2024
|
Analysis of 4Q24 Consolidated Results
|
|
05. Portfolio Quality and Provisions
|
|
NPL Ratio for Total Loans
|
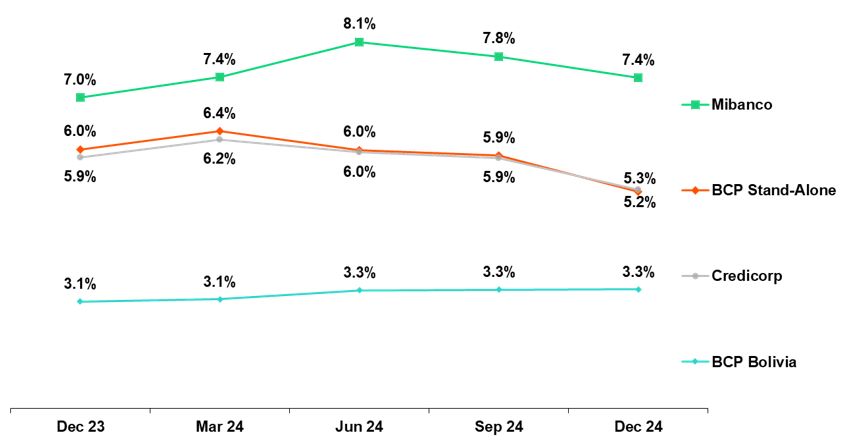
|
|
|
|
•
|
Mibanco, where the NPL ratio fell 41 bps, mainly on the back of a reduction in NPL
volumes.
|
|
NPL Ratio for Total Loans at BCP (1)
|
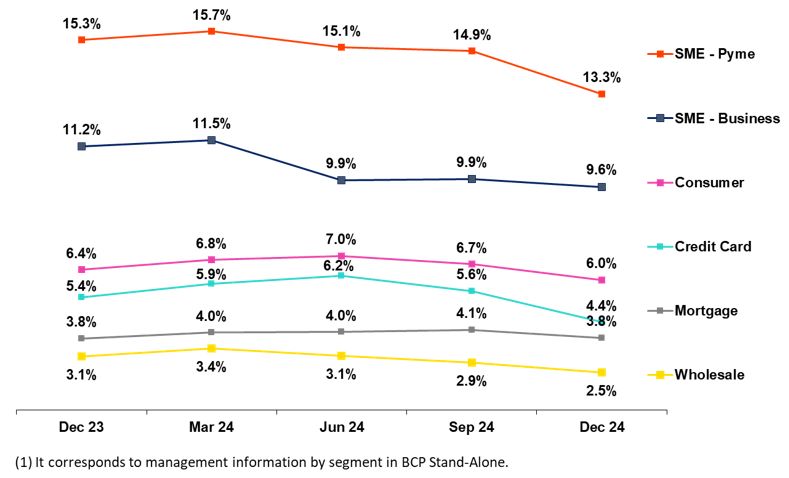
|
|
|
|
•
|
Mibanco, where the NPL Ratio rose 38 bps due to a contraction in the loan portfolio,
which was partially offset by a decrease in NPL volumes.
|
|
5.2
|
Provisions and Cost of Risk of the Total Portfolio
|
|
Loan Portfolio Provisions
|
Quarter
|
% change
|
Up to
|
% change
|
||||
|
S/000
|
4Q23
|
3Q24
|
4Q24
|
QoQ
|
YoY
|
Dec 23
|
Dec 24
|
Dec 24 / Dec 23
|
|
Gross provision for credit losses on loan portfolio
|
(1,260,163)
|
(981,870)
|
(857,694)
|
-12.6%
|
-31.9%
|
(3,957,143)
|
(3,943,301)
|
-0.3%
|
|
Recoveries of written-off loans
|
86,709
|
113,789
|
114,398
|
0.5%
|
31.9%
|
334,798
|
423,854
|
26.6%
|
|
Provision for credit losses on loan portfolio, net of recoveries
|
(1,173,454)
|
(868,081)
|
(743,296)
|
-14.4%
|
-36.7%
|
(3,622,345)
|
(3,519,447)
|
-2.8%
|
|
Cost of risk (1)
|
3.2%
|
2.4%
|
2.1%
|
-34 bps
|
-118 bps
|
2.5%
|
2.4%
|
-5 bps
|
|
(1)
|
Provisions for credit losses on loan portfolio, net of annualized recoveries / Average Total Loans. It includes provisions set aside for “El Niño” Phenomenon in 4Q23 and reversed in 1Q24.
|
|
| |
Earnings Release 4Q / 2024
|
Analysis of 4Q24 Consolidated Results
|
|
05. Portfolio Quality and Provisions
|
|
Cost of Risk by Subsidiary (1)
|
|||
|
YoY, if we isolate the effect of provisions set aside for the “El
Niño” Phenomenon in 4Q23, provisions dropped 19.2%, driven by BCP Stand- alone and Mibanco.
At BCP Stand-alone, the decrease in provisions was led mainly by SME-Pyme and
Consumer, which experienced an improvement in payment performance via the same dynamics seen QoQ and through a reduction in refinancing. This evolution was partially offset by Wholesale Banking, which reported an
increase in deterioration, associated in large part with two corporate clients. At Mibanco, the reduction was primarily attributable to the same
drivers seen QoQ. In this context, the CofR at Credicorp fell 48 bps YoY to stand at 2.1%.
|
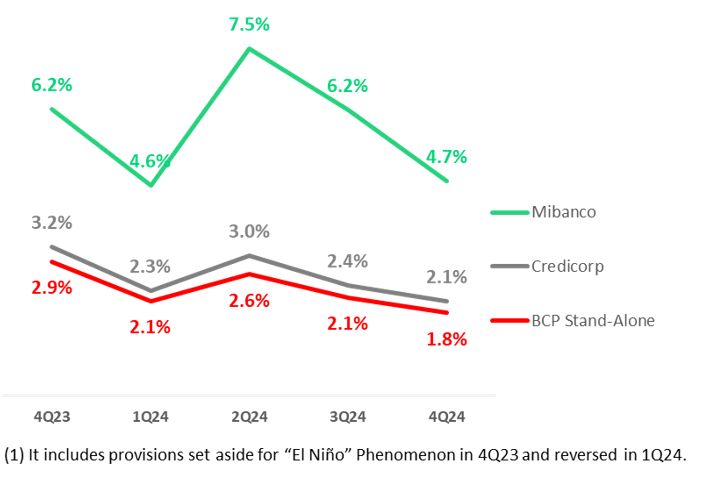 |
|
On a Full-Year basis, if we isolate the effect of provisions set aside for the El Niño Phenomenon in
4Q23 and reversed in 1Q24, provisions rose12.0%, mainly at BCP Stand-alone. This growth was driven mainly by Credit Cards, which reported a
deterioration in payment performance that accentuated in the first semester of 2024, and by Wholesale, which was impacted by a base effect generated by high reversal levels in 2023.
In this context, the CofR at Credicorp rose 30 bps FY to stand at 2.6%.
|
|
QoQ Cost of Risk Evolution
|
YoY Underlying Cost of Risk Evolution*
|
||||||||
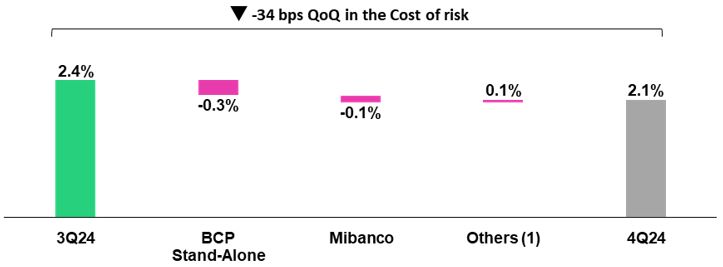 (1) Others include BCP Bolivia, Mibanco Colombia, ASB and eliminations.
|
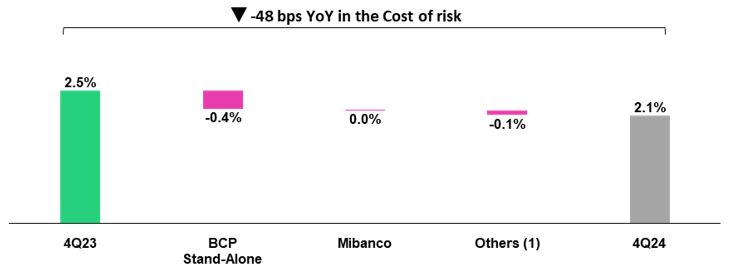
(*) It excludes provisions set aside for “El Niño” Phenomenon in 4Q23.
(1) Others include BCP Bolivia, Mibanco Colombia, ASB and eliminations.
|
||||||||
|
FY Underlying Cost of Risk Evolution*
|
|||||||||
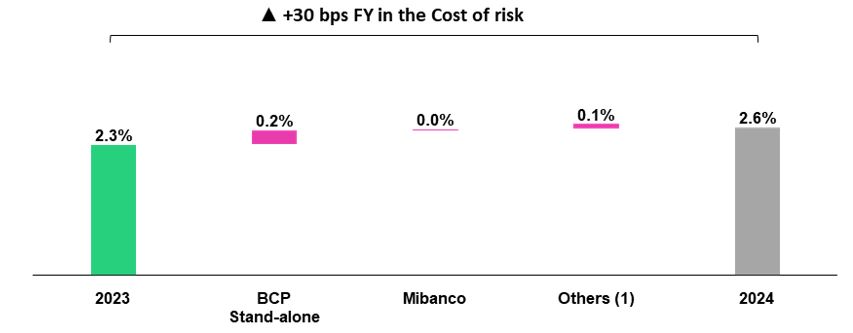
(*) It excludes provisions set aside for “El Niño” Phenomenon in 4Q23 and reversed in 1Q24.
(1) Others include BCP Bolivia, Mibanco Colombia, ASB and eliminations.
|
|||||||||
|
Loan Portfolio Quality and Delinquency Ratios
|
As of
|
% change
|
|||
|
S/000
|
Dec 23
|
Sep 24
|
Dec 24
|
QoQ
|
YoY
|
|
Total loans (Quarter-end balance)
|
144,976,051
|
142,568,785
|
145,732,273
|
2.2%
|
0.5%
|
|
Allowance for loan losses
|
8,277,916
|
8,250,023
|
7,994,977
|
-3.1%
|
-3.4%
|
|
Non-performing loans (NPLs)
|
8,532,545
|
8,360,155
|
7,662,657
|
-8.3%
|
-10.2%
|
|
Allowance for loan losses over Total loans
|
5.7%
|
5.8%
|
5.5%
|
-30 pbs
|
-22 pbs
|
|
Coverage ratio of NPLs
|
97.0%
|
98.7%
|
104.3%
|
566 pbs
|
732 pbs
|
|
| |
Earnings Release 4Q / 2024
|
Analysis of 4Q24 Consolidated Results
|
|
05. Portfolio Quality and Provisions
|
|
Allowance for loan losses
(in S/ millions)
|
|||
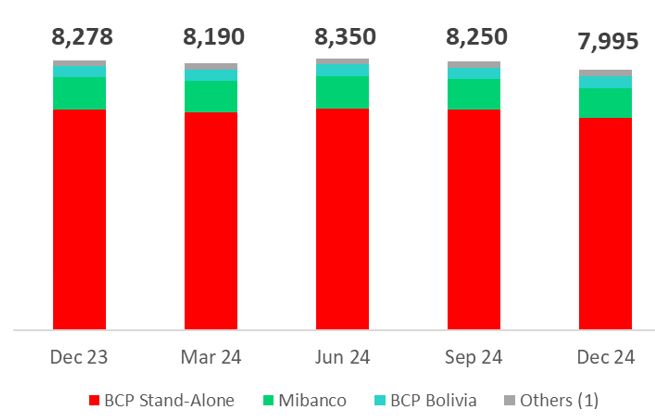 |
QoQ, the allowance for loan losses dropped 3.1%, fueled primarily by the evolution of SME-Pyme and Mortgage at BCP Stand-alone.
YoY, the allowance for loan losses fell 3.4%, driven mainly by
decreases in Small Businesses and Consumer at BCP Stand-alone, and secondarily by
a reduction at Mibanco.
|
||
|
(1) Others include Mibanco Colombia, ASB and eliminations.
|
|||
|
NPL Coverage Ratio
|
|||
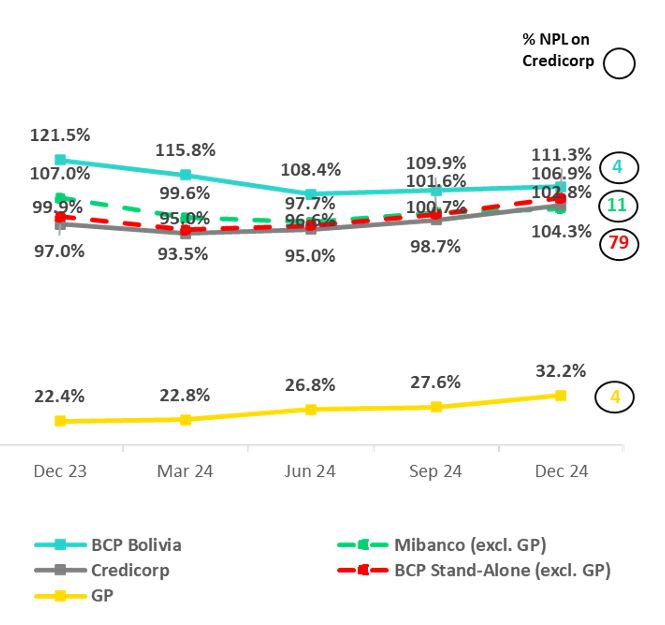 |
The total NPL Coverage Ratio at Credicorp reached 104.3% at the end of 4Q24. If we exclude the volume of NPLs in the Government Program portfolio
(GP), the ratio stood at 107.4%.
QoQ
Credicorp’s NPL Total Coverage Ratio rose 566 bps, fueled by the evolution at BCP Stand-alone
and Mibanco. Next, we will analyze this evolution by isolating the effect of NPLs from the Government
Loan portfolio, which are covered by broad guarantees and are being satisfactorily honored.
|
|
| |
Earnings Release 4Q / 2024
|
Analysis of 4Q24 Consolidated Results
|
|
06. Other Income
|
| 06 | Other Income |
|
As explained in recent quarters, we exclude BCP Bolivia results to
analyze the evolution of Other Income.
QoQ, growth of 0.6% in Other Core Income was driven by the Gain on FX
transactions, mainly at BCP Stand-alone. This growth was offset by a drop in fee income from Credicorp Capital. Other Non-core Income decreased 7.9% due to (i) a deterioration in an investment in
Pacifico’s portfolio, and (ii) a drop in the gain on securities at Credicorp Capital.
YoY, Other Core Income rose 17.1%, driven primarily by BCP
Stand-alone via (i) growth in fee income due to an uptick in transactions via Yape and Debit/Credit Cards, and (ii) an increase in FX transactions, driven by higher wholesale client’s volumes and
by improvements in pricing strategies. Other Non-core income fell 23.1%, due to the same factors seen QoQ.
FY, Other Core income rose 15.2%, driven by good results for fee income
and FX transactions at BCP Stand-alone and, to a lesser extent, at Credicorp Capital. This evolution reflects growth in transactions as the economy picks up. Other Non-core income dropped 0.9% due
to a drop in the gain on securities and losses from exchange differences.
|
||||
| 6.1. Other Core Income | ||||
|
Other Core Income
|
Quarter
|
% Change
|
Up to
|
% Change
|
||||
|
S/000
|
4Q23
|
3Q24
|
4Q24
|
QoQ
|
YoY
|
Dec 23
|
Dec 24
|
Dec 24 / Dec 23
|
|
Fee income
|
986,173
|
1,108,314
|
1,103,548
|
-0.4%
|
11.9%
|
3,804,459
|
4,423,193
|
16.3%
|
|
Net gain on foreign exchange transactions
|
218,047
|
172,998
|
223,913
|
29.4%
|
2.7%
|
886,126
|
781,076
|
-11.9%
|
|
Total other income Core
|
1,204,220
|
1,281,312
|
1,327,461
|
3.6%
|
10.2%
|
4,690,585
|
5,204,269
|
11.0%
|
|
•
|
QoQ, growth of 0.6% was driven by Net
Gain on Foreign Exchange Transactions (+3.4%) at BCP Stand-alone via an uptick in the volume of transactions executed by corporate clients.
The aforementioned was partially offset by a slight decline in Fee Income at Credicorp Capital.
|
|
•
|
YoY, expansion of 17.1% was driven by an increase in Fee Income at BCP Stand-alone and to the Net Gain on Foreign Exchange
Transactions (+14.7%) at BCP Stand-alone, which was fueled by growth in transactions among wholesale and retail clients and by improvements
in pricing strategies.
|
|
•
|
FY, the
uptick of 15.2% was fueled by growth in Fee Income, mainly at BCP
Stand-alone, and, to a lesser extent, at Credicorp Capital. The rise in the Net Gain on Foreign Exchange Transactions (+16.6%) at BCP Stand-alone was driven by the same factors QoQ and YoY.
|
|
Net Fee Income by Subsidiary
|
Quarter
|
% Change
|
Up to
|
% Change
|
||||
|
S/000
|
4Q23
|
3Q24
|
4Q24
|
QoQ
|
YoY
|
Dec 23
|
Dec 24
|
Dec 24 / Dec 23
|
|
BCP Stand-Alone
|
748,270
|
879,995
|
888,292
|
0.9%
|
18.7%
|
2,927,395
|
3,352,254
|
14.5%
|
|
BCP Bolivia
|
104,959
|
67,939
|
65,174
|
-4.1%
|
-37.9%
|
335,061
|
439,649
|
31.2%
|
|
Mibanco
|
24,402
|
18,412
|
24,108
|
30.9%
|
-1.2%
|
110,627
|
88,466
|
-20.0%
|
|
Mibanco Colombia
|
10,082
|
12,333
|
11,356
|
-3.7%
|
50.5%
|
42,550
|
45,982
|
8.1%
|
|
Pacífico
|
-2,577
|
-3,218
|
-3,115
|
-7.9%
|
-540.7%
|
-11,622
|
-12,020
|
3.4%
|
|
Prima
|
87,457
|
90,748
|
88,102
|
-7.4%
|
50.0%
|
350,846
|
372,480
|
6.2%
|
|
ASB
|
10,704
|
15,760
|
15,170
|
-3.2%
|
-129.1%
|
59,264
|
63,477
|
7.1%
|
|
Credicorp Capital
|
137,092
|
141,657
|
131,199
|
-2.9%
|
-35.7%
|
470,904
|
554,486
|
17.7%
|
|
Eliminations and Other (1)
|
-134,216
|
-115,312
|
-116,738
|
1.2%
|
-13.0%
|
-480,566
|
-481,581
|
0.2%
|
|
Total Net Fee Income
|
986,173
|
1,108,314
|
1,103,548
|
-0.4%
|
11.9%
|
3,804,459
|
4,423,193
|
16.3%
|
|
| |
Earnings Release 4Q / 2024
|
Analysis of 4Q24 Consolidated Results
|
|
06. Other Income
|
|
BCP Stand-alone Fees
|
Quarterly
|
% Change
|
Up to
|
% Change
|
||||
|
S/000,000
|
4Q23
|
3Q24
|
4Q24
|
QoQ
|
YoY
|
Dec 23
|
Dec 24
|
Dec 24 / Dec 23
|
|
Payments and transactionals (1)
|
322
|
377
|
361
|
4.3%
|
11.1%
|
1,302
|
1,411
|
8.4%
|
|
Yape (2)
|
42
|
96
|
118
|
-4.9%
|
7.4%
|
90
|
340
|
278.9%
|
|
Liability accounts (3)
|
186
|
198
|
192
|
2.7%
|
1.6%
|
724
|
760
|
4.9%
|
|
Loan Disbursement (4)
|
96
|
96
|
98
|
-2.3%
|
2.9%
|
372
|
385
|
3.4%
|
|
Off-balance sheet
|
57
|
57
|
55
|
-27.7%
|
28.4%
|
231
|
224
|
-3.0%
|
|
Insurances
|
32
|
34
|
35
|
-8.7%
|
-44.2%
|
126
|
137
|
8.7%
|
|
Wealth Management and Corporate Finance
|
5
|
13
|
19
|
8.3%
|
16.0%
|
33
|
59
|
78.2%
|
|
Others (5)
|
9
|
10
|
10
|
3.6%
|
11.4%
|
50
|
36
|
-27.6%
|
|
Total
|
748
|
880
|
888
|
0.9%
|
18.7%
|
2,928
|
3,352
|
14.5%
|
|
(*) Management figures.
|
|||
|
(1) Corresponds to fees from credit and debit cards, payments and collections.
|
|||
|
(2) Not includes fees related to E-Commerce. Not includes FX and remittances.
|
|||
|
(3) Corresponds to fees from Account maintenance, interbank transfers, national transfers, and international
transfers.
|
|||
|
(4) Corresponds to fees from retail and wholesale loan disbursements.
|
|||
|
(5) Use of third-party networks, other services to third parties, and Commissions in foreign branches.
|
|||
|
•
|
Yape, mainly via
Bill Payments, POS Payments (QR) and Yape for Businesses, associated with growth in transactions.
|
|
•
|
Wealth Management and Corporate Finance, which rose on the back of an increase in the total fee level in Wholesale Banking.
|
|
•
|
Yape, which
accounted for 54% of total growth in fee income; the App’s growth was attributable to the same factors seen in the QoQ analysis.
|
|
•
|
Payment and transactional services, which accounted for 27% of the growth
in fee income, was the result of an uptick in the use of credit cards (+24.8%) and debit cards (+16.5%), in line with an increase in liquidity via AFP withdrawals.
|
|
•
|
Wealth Management and Fincorp, which accounted for 10% of the growth in fee income, in line with the factors described in the QoQ analysis.
|
|
| |
Earnings Release 4Q / 2024
|
Analysis of 4Q24 Consolidated Results
|
|
06. Other Income
|
|
Other Non-Core Income
|
Quarter
|
% Change
|
Up to
|
% Change
|
||||
|
S/000
|
4Q23
|
3Q24
|
4Q24
|
QoQ
|
YoY
|
Dec 23
|
Dec 24
|
Dec 24 / Dec 23
|
|
Net gain on securities
|
115,825
|
120,033
|
-47,377
|
-139.5%
|
-140.9%
|
308,055
|
227,112
|
-26.3%
|
|
Net gain from associates (1)
|
34,132
|
35,600
|
38,560
|
8.3%
|
13.0%
|
117,089
|
135,183
|
15.5%
|
|
Net gain on derivatives held for trading
|
5,019
|
93,801
|
188,301
|
100.7%
|
N/A
|
53,665
|
363,834
|
578.0%
|
|
Net gain from exchange differences
|
15,255
|
-6,139
|
-21,365
|
248.0%
|
-240.1%
|
45,778
|
-41,058
|
-189.7%
|
|
Other non-financial income
|
112,372
|
96,675
|
176,384
|
82.5%
|
57.0%
|
440,653
|
514,779
|
16.8%
|
|
Total Other Non-Core Income
|
282,603
|
339,970
|
334,503
|
-1.6%
|
18.4%
|
965,240
|
1,199,850
|
24.3%
|
|
Other Non-Core Income
QoQ evolution
(millions of soles)
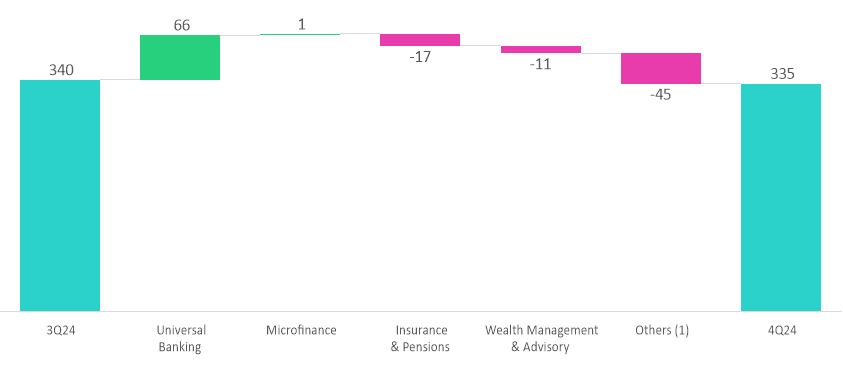 |
Other Non-Core Income
YoY evolution
(millions of soles)
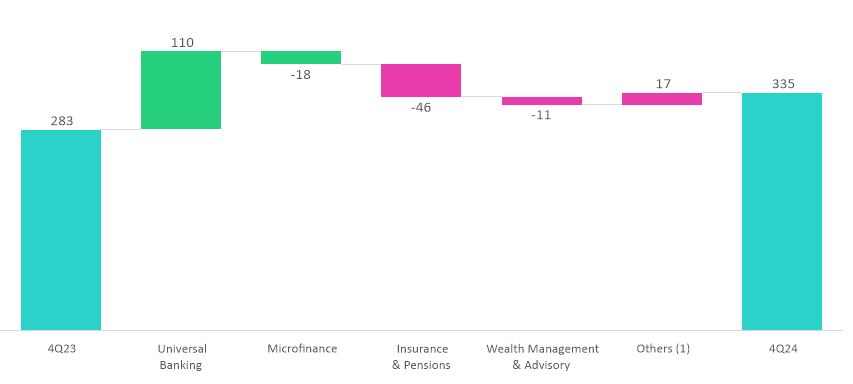 |
|
|
Other Non-Core Income
FY evolution
(millions of soles)
|
||
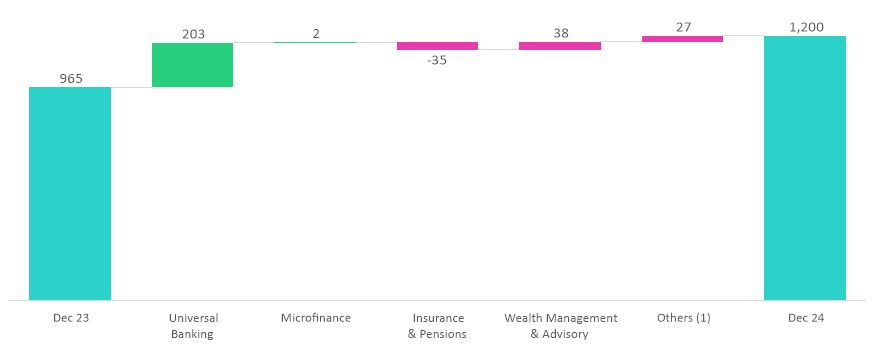 |
||
|
(1) Others: include Grupo Credito, Credicorp Stand-alone,
eliminations and others.
|
||
|
| |
Earnings Release 4Q / 2024
|
Analysis of 4Q24 Consolidated Results
|
|
06. Other Income
|
|
•
|
Net Gain (Loss) on Securities: (i) Pacifico reported losses due to the deterioration of an investment, (ii) Credicorp Capital was
impacted by a drop in income from trading, and (iii) BCP Stand-alone registered losses due to the devaluation of sovereign
bonds in the trading portfolio.
|
|
•
|
Net Gain (Loss) from Exchange Difference:
due to losses at ASB Bank Corp, which were driven by this portfolio’s
exposure in local currencies.
|
|
•
|
Net Gain (Loss) on Securities due to (i)
losses at Pacifico, as described in the QoQ analysis, (ii) BCP Stand-alone, due to the devaluation of a corporate bond and negative
results for sovereign bond trading, and (iii) Prima AFP, due to a drop in the profitability of funds under management.
|
|
•
|
Net Gain (Loss) from Exchange Difference: as
outlined in the QoQ analysis.
|
|
•
|
Net Gain (Loss) on Securities: due to (i)
losses at Pacifico, as outlined in the QoQ dynamics, and (ii) Others, due to a base
effect given that the market price for investments at Credicorp Stand-alone was higher in 2023. These losses were partially offset by BCP Stand-alone, which reported growth in ALM income and a revaluation of the trading portfolio.
|
|
•
|
Net Gain (Loss) from Exchange Difference: in
line with the factors outlined in the QoQ analysis.
|
|
| |
Earnings Release 4Q / 2024
|
Analysis of 4Q24 Consolidated Results
|
| 07 | Insurance Underwriting Results |
|
QoQ, the Insurance Underwriting Result increased
7.2%. Growth was mainly driven by a stronger Reinsurance Result in P & C.
Additionally, higher Insurance Service Income in
both business lines contributed to the higher underwriting result. These positive dynamics were partially offset by growth in Insurance Service Expenses in both
businesses.
YoY, theaInsuranceSUnderwriting Result rose 8.8%, due to lower Insurance Service Expenses in Life, mainly in D&S and Individual
Life, and higher Insurance Service Income in
P&C. For the FY24, the Insurance Underwriting Result decreased by 1.0% due to lower results in Life and Crediseguros businesses. In terms of business lines,
this decline was driven by Credit Life, Annuities and Individual Life.
|
|
Insurance Underwriting Results
|
Quarterly
|
% change
|
Year
|
% change
|
|||||
|
S/000
|
4Q23
|
3Q24
|
4Q24
|
QoQ
|
YoY
|
2023
|
2024
|
2024 / 2023
|
|
|
Income from Insurance Services
|
1,019.6
|
940.9
|
982.5
|
4.4%
|
-3.6%
|
3,843
|
3,771
|
-1.9%
|
|
|
Total
|
Expenses for Insurance Services
|
(634.0)
|
(514.7)
|
(570.0)
|
10.7%
|
-10.1%
|
(2,235)
|
(2,057)
|
-8.0%
|
|
Reinsurance Results
|
(98.4)
|
(134.4)
|
(99.9)
|
-25.7%
|
1.6%
|
(397)
|
(515)
|
29.6%
|
|
|
Insurance Undewrwriting Result
|
287.3
|
291.8
|
312.7
|
7.2%
|
8.8%
|
1,211
|
1,199
|
-1.0%
|
|
|
Income from Insurance Services
|
449.8
|
471.1
|
491.9
|
4.4%
|
9.4%
|
1,695
|
1,875
|
10.6%
|
|
|
P&C
|
Expenses for Insurance Services
|
(323.7)
|
(278.1)
|
(331.0)
|
19.0%
|
2.3%
|
(1,139)
|
(1,149)
|
0.9%
|
|
Reinsurance Results
|
(76.8)
|
(120.4)
|
(83.8)
|
-30.4%
|
9.1%
|
(293)
|
(432)
|
47.5%
|
|
|
Insurance Undewrwriting Result
|
49.3
|
72.6
|
77.2
|
6.3%
|
56.4%
|
263
|
293
|
11.5%
|
|
|
Income from Insurance Services
|
534.8
|
453.0
|
471.5
|
4.1%
|
-11.8%
|
2,033
|
1,819
|
-10.5%
|
|
|
Life
|
Expenses for Insurance Services
|
(305.1)
|
(234.5)
|
(238.7)
|
1.8%
|
-21.8%
|
(1,076)
|
(910)
|
-15.4%
|
|
Reinsurance Results
|
(14.5)
|
(9.4)
|
(10.2)
|
8.7%
|
-29.8%
|
(83)
|
(62)
|
-25.5%
|
|
|
Insurance Undewrwriting Result
|
215.2
|
209.1
|
222.6
|
6.4%
|
3.4%
|
874
|
846
|
-3.1%
|
|
|
Income from Insurance Services
|
37.1
|
23.5
|
25.3
|
7.7%
|
-31.8%
|
124
|
99
|
-19.8%
|
|
|
Crediseguros
|
Expenses for Insurance Services
|
(11.5)
|
(7.1)
|
(5.6)
|
-20.8%
|
-51.0%
|
(39)
|
(18)
|
-53.2%
|
|
Reinsurance Results
|
(9.1)
|
(11.2)
|
(12.3)
|
9.7%
|
35.6%
|
(30)
|
(42)
|
40.6%
|
|
|
Insurance Undewrwriting Result
|
16.5
|
5.2
|
7.3
|
42.6%
|
-55.6%
|
54
|
39
|
-29.0%
|
|
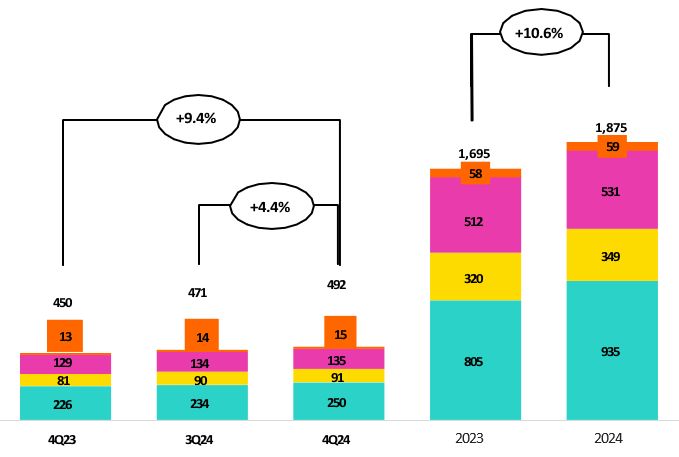 |
 |
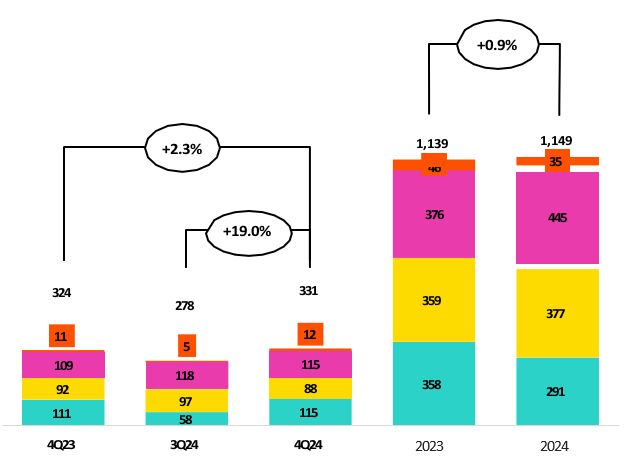 |
|
•
|
Insurance Service Income increased 4.4%, reflecting growth in premiums allocated to the
period1 in P & C Risks through the Fire, Agricultural and Card Protection products.
|
|
•
|
Insurance Income Expenses rose 19.0%, driven mainly by P & C Risks via an uptick in
expenses for claims in the Fire and Technical Lines, and higher technical expenses in the Alliances channel.
|
|
|
|
| |
Earnings Release 4Q / 2024
|
Analysis of 4Q24 Consolidated Results
|
|
07. Insurance Underwriting Result
|
|
•
|
The improvement in the Reinsurance Result was mainly attributable to the evolution
at P & C Risks, which registered an increase in claims recovered from reinsurers (for claims in the Fire and Technical Lines mentioned
above).
|
|
•
|
Insurance Service Income rose 9.4%, fueled by an increase in premiums allocated to
the period in P & C Risks, in line with an uptick in premium turnover in Third-Party Liability and Card Protection.
|
|
•
|
Insurance Service Expenses rose 2.3%, spurred mainly by Medical Assistance, which
reported a higher level of expenses for claims due to an increase in average costs and higher IBNR reserves.
|
|
•
|
The Reinsurance Result deteriorated primarily due to the evolution of P & C
Risks, which was impacted by an increase in ceded premiums.
|
|
Insurance Service Income
|
Insurance Service Expenses
|
|
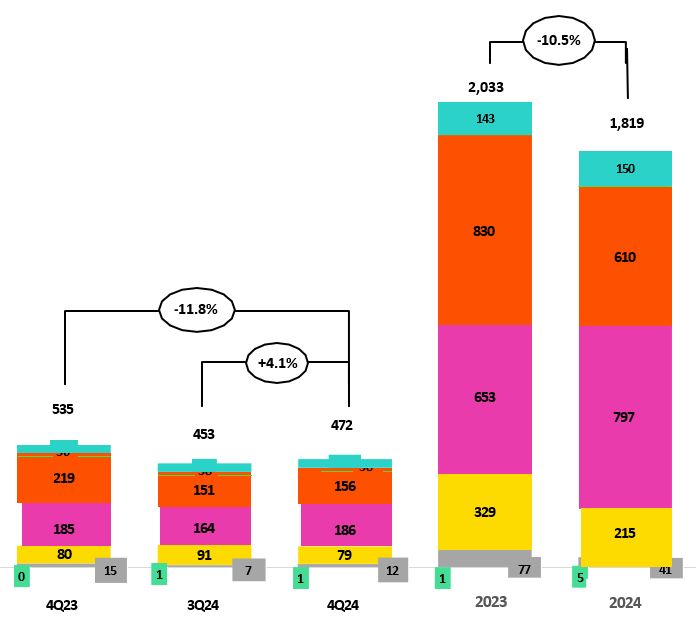 |
 |
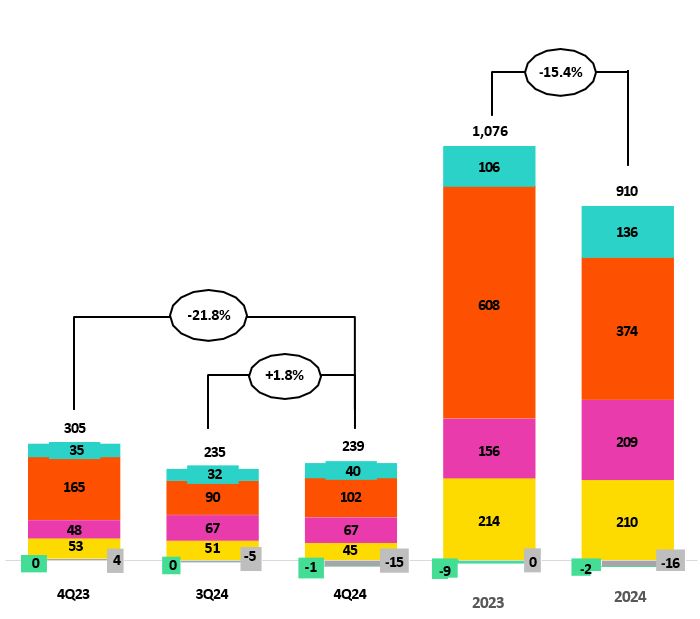 |
|
•
|
Insurance Service Income rose 4.1%, driven primarily by Credit
Life via an increase in premiums allocated to the period, which was in turn fueled mainly by the bancassurance and Alliances channels. The
aforementioned growth was partially offset by a drop in income in Group Line, mainly via seasonal factors in SCTR products.
|
|
•
|
Insurance Service Expenses increased 1.8%, fueled primarily by
(i) D&S, which reported an increase in expenses for claims in line with growth in cases and in the average cost, and (ii) Annuities, due to
an increase in onerous contracts.
|
|
•
|
The Reinsurance Underwriting Result dropped, which was driven
mainly by Individual Life via a decrease in reinsurance recoveries.
|
|
•
|
Insurance Service Income dropped 11.8%, driven mainly by
D&S, which won a smaller tranche of the SISCO VII contract and at lower rates in comparison to the award secured under SISCO VI.
|
|
•
|
Insurance Service Expenses fell 21.8%, primarily due to (i)
D&S, in line with a reduction in the tranche awarded under SISCO VII, and (ii) Individual Life, which reported a drop in claims. The
reduction in total expenses was attenuated by the evolution at Credit Life, which reported growth in underwriting expenses for Alliances and an
increase in claims.
|
|
•
|
The Reinsurance Result improved, fueled primarily by a
decrease in ceded premiums in D&S.
|
|
| |
Earnings Release 4Q / 2024
|
Analysis of 4Q24 Consolidated Results
|
| 08 | Operating Expenses |
|
Operating expenses rose
9.4% YTD, driven mainly by core businesses at BCP Stand-alone and disruptive initiatives at the Credicorp level. Expenses for core businesses at
BCP rose due to: (i) increased salary and benefit expenses from hiring more talent, and variable compensation provisioning, and (ii) growth in
administrative expenses, which was driven primarily by an increase in cloud use after transactions levels rose, fueled by increasingly digitalized
clients. Expenses for disruptive initiatives at the Credicorp level increased 27.1%.
|
|
Operating expenses
|
Quarter
|
% change
|
Year
|
% change
|
||||
|
S/000
|
4Q23
|
3Q24
|
4Q24
|
QoQ
|
YoY
|
2023
|
2024
|
2024 / 2023
|
|
Salaries and employees benefits
|
1,119,758
|
1,155,966
|
1,271,578
|
10.0%
|
13.6%
|
4,265,453
|
4,676,436
|
9.6%
|
|
Administrative, general and tax expenses
|
1,089,203
|
1,047,386
|
1,230,099
|
17.4%
|
12.9%
|
3,803,203
|
4,183,775
|
10.0%
|
|
Depreciation and amortization
|
177,618
|
179,495
|
186,625
|
4.0%
|
5.1%
|
659,007
|
713,470
|
8.3%
|
|
Association in participation
|
9,109
|
6,414
|
3,808
|
-40.6%
|
-58.2%
|
53,097
|
28,269
|
-46.8%
|
|
Operating expenses
|
2,395,688
|
2,389,261
|
2,692,110
|
12.7%
|
12.4%
|
8,780,760
|
9,601,950
|
9.4%
|
|
•
|
Growth in Salaries and Employee Benefits, which was fueled mainly by an
increase in personnel for both the traditional business and specialized IT, and secondarily by an uptick in expenses for provisions for
variable compensation.
|
|
•
|
An increase in Administrative, general and tax expenses, driven by growth in
transactions via digital channels, which led to a subsequent uptick in expenses for cloud use and other IT-related activities.
|
|
Administrative, general and tax expenses
|
Quarter
|
% change
|
Year
|
% change
|
||||
|
S/000
|
4Q23
|
3Q24
|
4Q24
|
QoQ
|
YoY
|
2023
|
2024
|
2024 / 2023
|
|
IT expenses and IT third-party services
|
311,417
|
287,372
|
386,150
|
34.4%
|
24.0%
|
1,080,001
|
1,251,424
|
15.9%
|
|
Advertising and customer loyalty programs
|
239,028
|
199,111
|
243,129
|
22.1%
|
1.7%
|
720,718
|
770,965
|
7.0%
|
|
Taxes and contributions
|
93,090
|
90,080
|
105,296
|
16.9%
|
13.1%
|
264,326
|
382,711
|
44.8%
|
|
Audit Services, Consulting and professional fees
|
105,340
|
101,570
|
171,101
|
68.5%
|
62.4%
|
336,715
|
407,508
|
21.0%
|
|
Transport and communications
|
60,869
|
62,568
|
67,398
|
7.7%
|
10.7%
|
226,860
|
244,255
|
7.7%
|
|
Repair and maintenance
|
49,698
|
36,316
|
50,981
|
40.4%
|
2.6%
|
157,127
|
154,533
|
-1.7%
|
|
Agents' Fees
|
31,911
|
29,957
|
31,436
|
4.9%
|
-1.5%
|
115,120
|
118,156
|
2.6%
|
|
Services by third-party
|
43,936
|
36,689
|
6,220
|
-83.0%
|
-85.8%
|
144,534
|
107,274
|
-25.8%
|
|
Leases of low value and short-term
|
30,205
|
26,378
|
36,936
|
40.0%
|
22.3%
|
108,357
|
124,781
|
15.2%
|
|
Miscellaneous supplies
|
30,589
|
23,552
|
24,864
|
5.6%
|
-18.7%
|
118,510
|
91,769
|
-22.6%
|
|
Security and protection
|
16,575
|
16,909
|
16,614
|
-1.7%
|
0.2%
|
64,432
|
65,970
|
2.4%
|
|
Subscriptions and quotes
|
18,444
|
18,349
|
14,261
|
-22.3%
|
-22.7%
|
61,945
|
74,002
|
19.5%
|
|
Electricity and water
|
16,316
|
11,857
|
15,053
|
27.0%
|
-7.7%
|
56,359
|
52,260
|
-7.3%
|
|
Electronic processing
|
11,284
|
7,578
|
8,124
|
7.2%
|
-28.0%
|
39,764
|
29,466
|
-25.9%
|
|
Insurance
|
4,518
|
28,296
|
14,312
|
-49.4%
|
216.8%
|
56,324
|
55,150
|
-2.1%
|
|
Cleaning
|
6,122
|
5,761
|
8,415
|
46.1%
|
37.5%
|
22,677
|
25,549
|
12.7%
|
|
Others
|
19,861
|
65,043
|
29,809
|
-54.2%
|
50.1%
|
229,434
|
228,002
|
-0.6%
|
|
Total
|
1,089,203
|
1,047,386
|
1,230,099
|
17.4%
|
12.9%
|
3,803,203
|
4,183,775
|
10.0%
|
|
| |
Earnings Release 4Q / 2024
|
Analysis of 4Q24 Consolidated Results
|
|
08. Operating
Expenses
|
|
Operating Expenses
|
Quarter
|
% change
|
Year
|
% change
|
||||
|
S/000
|
4Q23
|
3Q24
|
4Q24
|
QoQ
|
YoY
|
2023
|
2024
|
2024 / 2023
|
|
Core Business BCP
|
1,359,738
|
1,316,399
|
1,536,314
|
16.7%
|
13.0%
|
4,901,001
|
5,357,641
|
9.3%
|
|
Core Business Mibanco
|
149,437
|
315,089
|
313,667
|
-0.5%
|
109.9%
|
1,200,445
|
1,228,873
|
2.4%
|
|
Core Business Pacifico
|
85,485
|
64,306
|
84,896
|
32.0%
|
-0.7%
|
301,816
|
300,773
|
-0.3%
|
|
Disruption (2)
|
331,673
|
295,848
|
416,970
|
40.9%
|
25.7%
|
976,598
|
1,243,401
|
27.3%
|
|
Others (3)
|
469,355
|
397,619
|
340,263
|
-14.4%
|
-27.5%
|
1,400,900
|
1,471,261
|
5.0%
|
|
Total
|
2,395,688
|
2,389,261
|
2,692,110
|
12.7%
|
12.4%
|
8,780,760
|
9,601,950
|
9.4%
|
|
(1)
|
Management figures.
|
|
(2)
|
Includes disruptive initiatives at the subsidiaries and Krealo.
|
|
(3)
|
Includes Credicorp Capital, ASB, Prima, BCP Bolivia, Mibanco
Colombia, and other entities within the Group.
|
|
•
|
Core business expenses excluding IT
|
|
•
|
Higher expenses for salaries and employee benefits; this
reflected an increase in hiring and provisioning for variable compensation, which went hand-in-hand with an improvement in
results.
|
|
•
|
Technology Expenses (IT)
|
|
•
|
Growth in expenses for server use, which was driven by an
uptick in transactions among increasingly digitalized clients. Total monetary transactions and transactions through digital
channels rose 84.2% and 104.8%, respectively.
|
|
•
|
More digital talent personnel was hired with comparatively
higher average salaries, which reflects advances in strategic project development.
|
|
| |
Earnings Release 4Q / 2024
|
Analysis of 4Q24 Consolidated Results
|
| 09 | Operating Efficiency |
|
The
efficiency ratio improved 30 bps YTD, after growth in income outstripped the increase in expenses. This evolution was driven
by growth in core income, which was fueled by (i) a rise in net interest income, which rose on the back of higher
contribution from the retail segments and (ii) growth in fee income, led by Yape and core transactional activity.
|
|
Subsidiary
|
Quarter
|
% change
|
As of
|
% change
|
||||
|
4Q23
|
3Q24
|
4Q24
|
QoQ
|
YoY
|
Dec 23
|
Dec 24
|
Dec 24 / Dec 23
|
|
|
BCP
|
41.8%
|
37.6%
|
44.8%
|
720 bps
|
300 bps
|
38.8%
|
39.3%
|
48 bps
|
|
BCP Bolivia
|
59.0%
|
80.3%
|
63.0%
|
-1730 bps
|
400 bps
|
61.3%
|
63.9%
|
260 bps
|
|
Mibanco Perú
|
52.9%
|
54.2%
|
52.2%
|
-200 bps
|
-70 bps
|
52.7%
|
52.7%
|
0 bps
|
|
Mibanco Colombia
|
98.2%
|
72.0%
|
69.5%
|
-260 bps
|
-2870 bps
|
91.6%
|
76.2%
|
-1540 bps
|
|
Pacífico
|
34.9%
|
25.5%
|
29.6%
|
410 bps
|
-530 bps
|
26.5%
|
27.6%
|
110 bps
|
|
Prima AFP
|
54.2%
|
50.7%
|
64.2%
|
1348 bps
|
410 bps
|
51.3%
|
54.2%
|
292 bps
|
|
Credicorp
|
49.0%
|
45.2%
|
49.2%
|
398 bps
|
21 bps
|
46.1%
|
45.8%
|
-30 bps
|
|
| |
Earnings Release 4Q / 2024
|
Analysis of 4Q24 Consolidated Results
|
| 10 | Regulatory
Capital |
|
The
Regulatory Capital Ratio at Credicorp stood 1.37 times above the regulatory limit.
The IFRS CET1 ratio at BCP Stand-alone increased 12 bps YoY to stand at 13.32%, driven by
growth in the balance of Retained Earnings (+21.2%) and partially offset by an uptick in the RWA level (+5.2%).
The IFRS CET1 ratio at Mibanco dropped 84 bps YoY, situating at 17.53%. The decrease in
Retained Earnings (-109.3%) due to dividend payments, partially offset by a drop in the RWA level (6.3%), drove
this dynamic.
|
|
10.1
|
Regulatory
Capital at Credicorp
|
|
•
|
Minimum required for CET 1: 45% of Credicorp’s
capital requirement and 100% of the conservation, economic cycle and risk concentration buffers.
|
|
•
|
Minimum required for Tier 1: 60% of Credicorp’s
capital requirement and 100% of the conservation, economic cycle and risk concentration buffers.
|
|
At Credicorp, the Regulatory
Capital Ratio stood at 1.37 at the end of 4Q24. This attests to the Group’s financial strenght and stability.
The ratio dropped 6 bps QoQ, driven by an increase in Regulatory Capital requirement, which rose on the back of
loan growth at the subsidiaries, and an increase in the combined buffers requirements according to the
established schedule. The decline in the ratio was offset by growth in Total Regulatory Capital, which rose on
the back of growth in Earnings and Accumlated Results, particularly via BCP
Stand-alone.
Regulatory Tier 1 stood at 1.67 (-12 bps QoQ) while the CET1 ratio situated
at 2.02 (-17 bps QoQ), both above the minimum required. Growth in both was driven by the same dynamics as
those that drove the Regulatory Capital Ratio
|
Capital Coverage Ratios
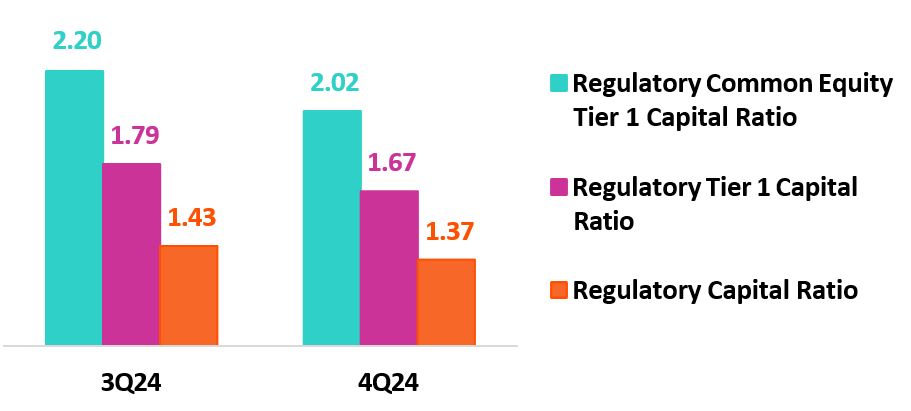 |
|
| |
Earnings Release 4Q / 2024
|
Analysis of 4Q24 Consolidated Results
|
|
10.
Regulatory Capital
|
10.2 Analysis of Capital at BCP Stand-alone
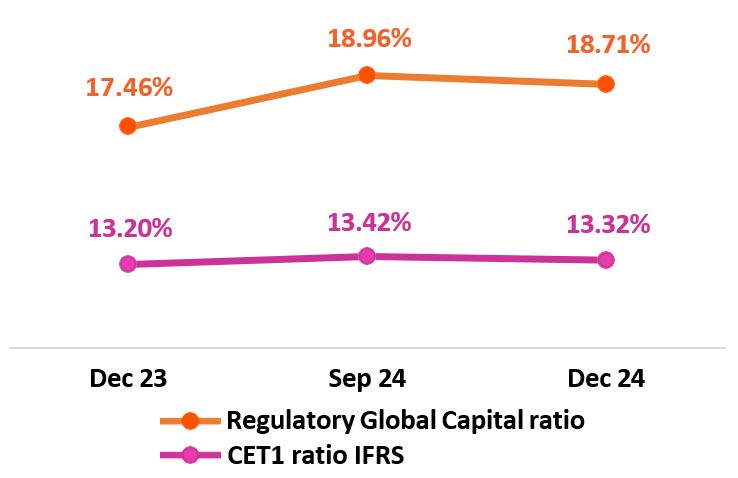
10.3 Analysis of Capital at Mibanco
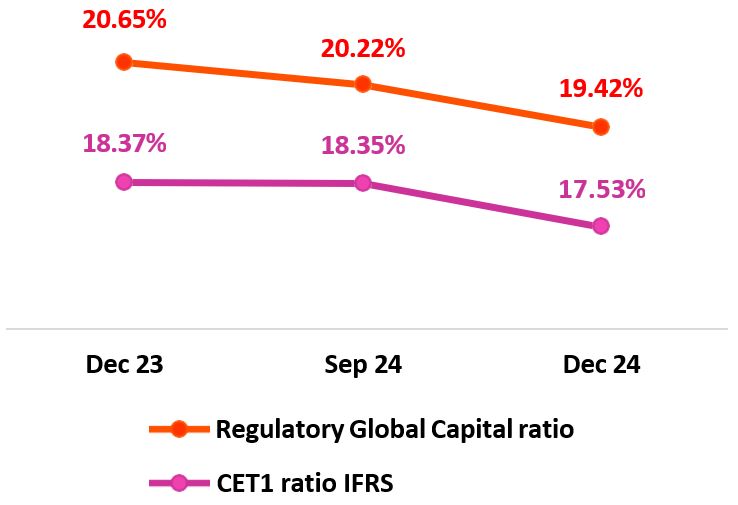
|
| |
Earnings Release 4Q / 2024
|
Analysis of 4Q24 Consolidated
Results
|
11 Economic Outlook
|
In 4Q24, the Peruvian economy is expected
to have grown around 4% YoY. Primary sectors are estimated to have expanded 4.7% YoY, driven
by the fishing and agriculture sectors, while non-primary sectors are projected to have slowed
approximately 4.0%. At the end of 2024, GDP grew around 3.2%, amid a cyclical and gradual
recovery.
The annual inflation rate increased
marginally, closing the quarter at 2.0% YoY (1.8% YoY in 3Q24). In January 2025, BCRP cut its
reference rate 25bps to 4.75%, after closing 2024 at 5.00%.
BCRP has indicated that the exchange rate closed at USDPEN 3.76
in 4Q24, deppreciating 1.6% over the figure of 3Q24. This result situates the Peruvian Sol
among the best-performing emerging market currencies.
|
|
2019
|
2020
|
2021
|
2022
|
2023
|
2024 (4)
|
2025 (4)
|
|
|
GDP (US$ Millions)
|
232,447
|
205,689
|
225,433
|
244,465
|
267,346
|
280,326
|
295,521
|
|
Real GDP (% change)
|
2.2
|
(10.9)
|
13.4
|
2.7
|
(0.6)
|
3.2
|
2.8
|
|
GDP per capita (US$)
|
7,234
|
6,304
|
6,824
|
7,320
|
7,927
|
8,220
|
8,588
|
|
Domestic demand (%
change)
|
2.2
|
(9.6)
|
14.5
|
2.4
|
(2.1)
|
3.6
|
2.9
|
|
Gross fixed investment
(as % GDP)
|
22.5
|
21.0
|
25.1
|
25.2
|
22.9
|
23.2
|
23.2
|
|
Financial system loan
without Reactiva (% change) (1)
|
6.4
|
(4.3)
|
12.6
|
9.7
|
2.8
|
1.3
|
5.5
|
|
Inflation, end of period(2)
|
1.9
|
2.0
|
6.4
|
8.5
|
3.2
|
2.0
|
2.5
|
|
Reference Rate, end of
period
|
2.25
|
0.25
|
2.50
|
7.50
|
6.75
|
5.00
|
4.25
|
|
Exchange rate, end of
period
|
3.31
|
3.62
|
3.99
|
3.81
|
3.71
|
3.76
|
3.75
|
|
Exchange rate, (%
change) (3)
|
1.8%
|
-9.3%
|
-10.3%
|
4.5%
|
2.7%
|
-1.3%
|
0.2%
|
|
Fiscal balance (% GDP)
|
-1.6
|
-8.9
|
-2.5
|
-1.7
|
-2.8
|
-3.6
|
-2.6
|
|
Public Debt (as % GDP)
|
26.6
|
34.6
|
35.8
|
33.9
|
32.9
|
34.0
|
34.0
|
|
Trade balance (US$
Millions)
|
6,879
|
8,102
|
15,115
|
10,166
|
17,678
|
22,000
|
22,500
|
|
(As % GDP)
|
3.0%
|
3.9%
|
6.7%
|
4.2%
|
6.6%
|
7.8%
|
7.6%
|
|
Exports
|
47,980
|
42,826
|
63,114
|
66,167
|
67,518
|
73,500
|
75,500
|
|
Imports
|
41,101
|
34,724
|
47,999
|
56,001
|
49,840
|
51,500
|
53,000
|
|
Current account balance
(As % GDP)
|
-0.6%
|
0.9%
|
-2.1%
|
-4.0%
|
0.8%
|
2.2%
|
1.3%
|
|
Net international
reserves (US$ Millions)
|
68,316
|
74,707
|
78,495
|
71,883
|
71,033
|
78,987
|
83,000
|
|
(As % GDP)
|
29.4%
|
36.3%
|
34.8%
|
29.4%
|
26.6%
|
28.2%
|
28.1%
|
|
(As months of imports)
|
20
|
26
|
20
|
15
|
17
|
18
|
19
|
|
(1)
|
Financial System, Current
Exchange Rate
|
|
(2)
|
Inflation Target: 1%-3%
|
|
(3)
|
Negative % change indicates
depreciation.
|
|
(4)
|
Grey area indicates
estimates by BCP – Economic Research as of January 2025.
|
|
| |
Earnings Release 4Q / 2024
|
Analysis of 4Q24
Consolidated Results
|
|
11. Economic Outlook
|
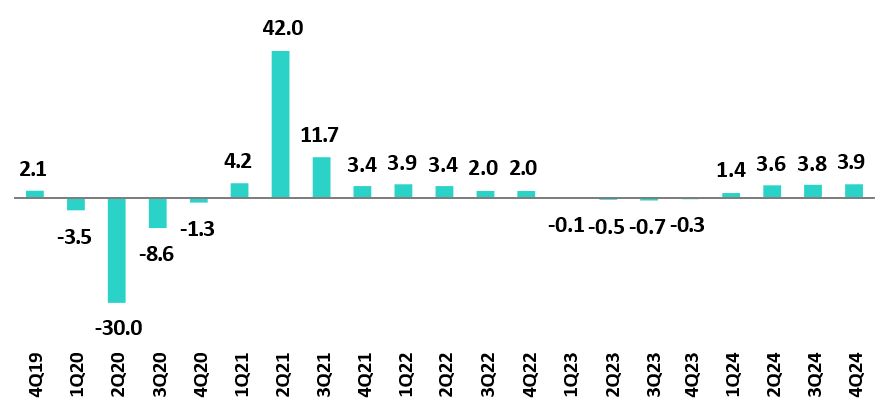
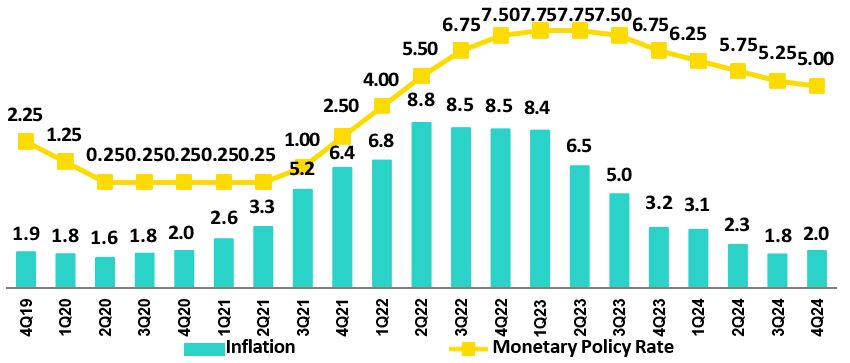
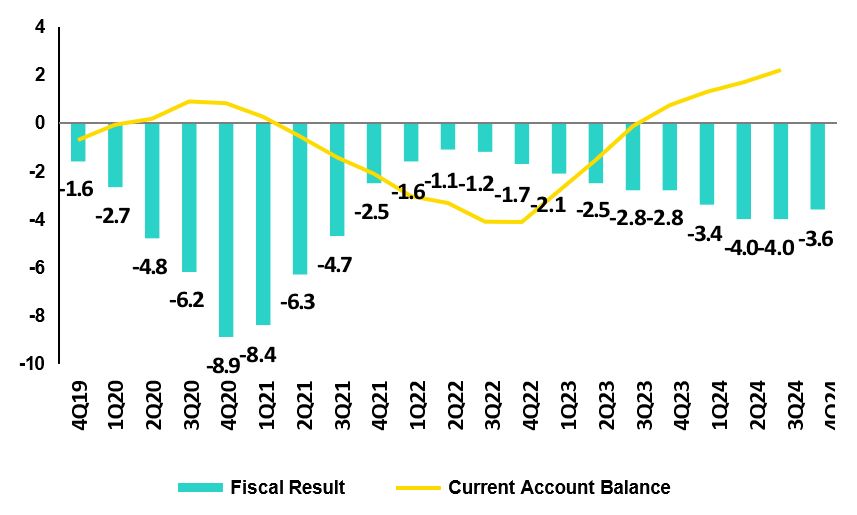
|
|
|
| |
Earnings Release 4Q / 2024
|
Analysis of 4Q24
Consolidated Results
|
|
11. Economic Outlook
|
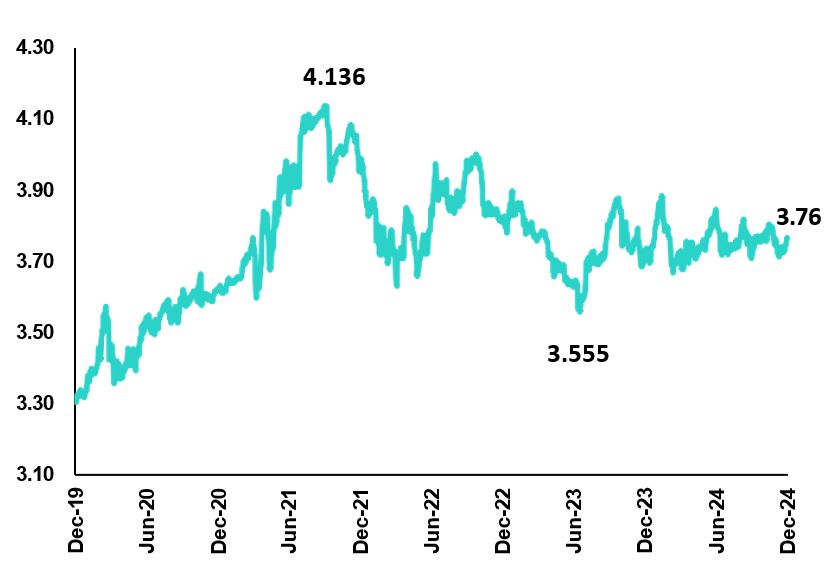
|
| |
Earnings Release 4Q / 2024
|
Analysis of 4Q24
Consolidated Results
|
|
Safe Harbor for Forward-Looking Statements
|
|
•
|
The occurrence of natural
disasters or political or social instability in Peru;
|
|
•
|
The adequacy of the
dividends that our subsidiaries are able to pay to us, which may affect our ability to
pay dividends to shareholders and corporate expenses;
|
|
•
|
Performance of, and
volatility in, financial markets, including Latin-American and other markets;
|
|
•
|
The frequency, severity
and types of insured loss events;
|
|
•
|
Fluctuations in interest
rate levels;
|
|
•
|
Foreign currency exchange
rates, including the Sol/US Dollar exchange rate;
|
|
•
|
Deterioration in the
quality of our loan portfolio;
|
|
•
|
Increasing levels of
competition in Peru and other markets in which we operate;
|
|
•
|
Developments and changes
in laws and regulations affecting the financial sector and adoption of new
international guidelines;
|
|
•
|
Changes in the policies
of central banks and/or foreign governments;
|
|
•
|
Effectiveness of our risk
management policies and of our operational and security systems;
|
|
•
|
Losses associated with
counterparty exposures;
|
|
•
|
The scope of the
coronavirus (“COVID-19”) outbreak, actions taken to contain the COVID-19 and related
economic effects from such actions and our ability to maintain adequate staffing; and
|
|
•
|
Changes in Bermuda laws
and regulations applicable to so-called non-resident entities.
|
|
| |
Earnings Release 4Q / 2024
|
Analysis of 4Q24
Consolidated Results
|
12 Appendix
| 12.1. | Physical Point of Contact | 47 |
| 12.2. | Loan Portfolio Quality | 47 |
| 12.3. | Net Interest Income (NII) | 51 |
| 12.4. | Net Interest Margin (NIM) and Risk Adjusted NIM | 51 |
| 12.5. | Regulatory Capital | 52 |
| 12.6. | Financial Statements and Ratios by Business | 56 |
| 12.6.1. | Credicorp Consolidated | 56 |
| 12.6.2. | Credicorp Stand-alone | 58 |
| 12.6.3. | BCP Consolidated | 59 |
| 12.6.4. | BCP Stand-alone | 61 |
| 12.6.5. | BCP Bolivia | 63 |
| 12.6.6. | Mibanco | 64 |
| 12.6.7. | Prima AFP | 65 |
| 12.6.8. | Grupo Pacifico | 66 |
| 12.6.9. | Investment Management and Advisory | 68 |
| 12.7. | Table of Calculations | 69 |
| 12.8. | Glossary of terms | 70 |
|
| |
Earnings Release 4Q / 2024
|
Analysis of 4Q24
Consolidated Results
|
|
12. Appendix
|
|
Physical Point of Contact (1)
(Units)
|
|
As of |
Change (units)
|
||
|
Dec 23
|
Sep 24
|
Dec 24
|
QoQ
|
YoY
|
|
|
Branches
|
659
|
648
|
648
|
0
|
-11
|
|
ATMs
|
2,746
|
2,765
|
2,787
|
22
|
41
|
|
Agents
|
12,410
|
11,653
|
12,434
|
781
|
24
|
|
Total
|
15,815
|
15,066
|
15,869
|
803
|
54
|
|
(1)
|
Includes
Physical Point of Contact of BCP Stand-Alone, Mibanco and BCP Bolivia
|
|
(2)
|
Includes
Banco de la Nacion branches, which in December 23 were 36, in September
24 were 36 and in December 24 were 36
|
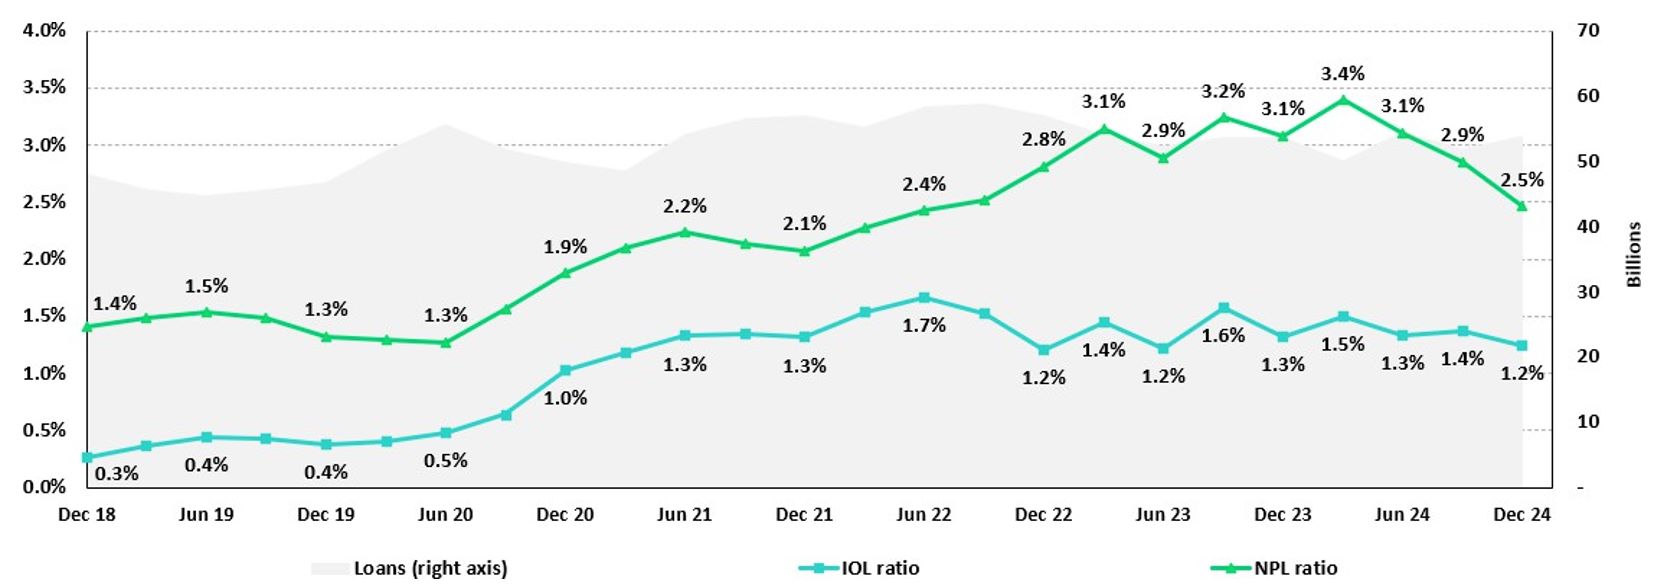
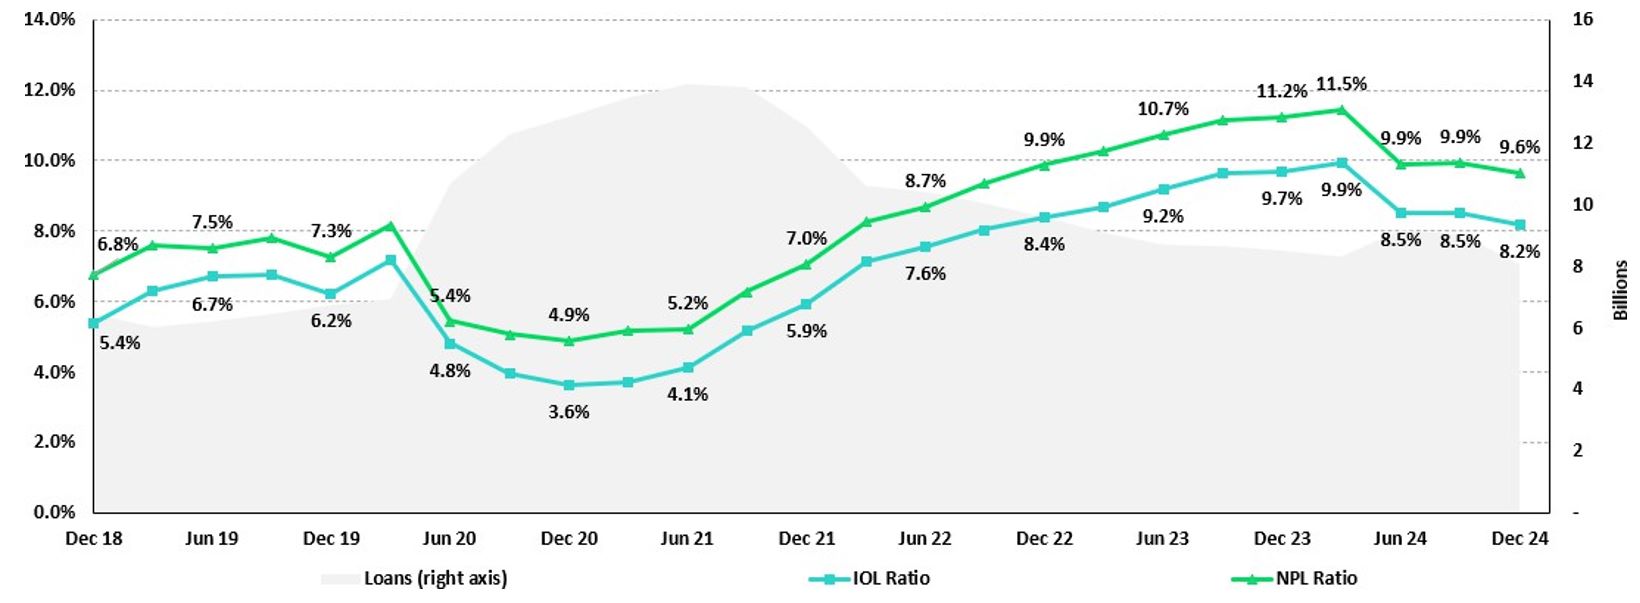
|
| |
Earnings Release 4Q /
2024
|
Analysis
of 4Q24 Consolidated Results
|
|
12.
Appendix
|
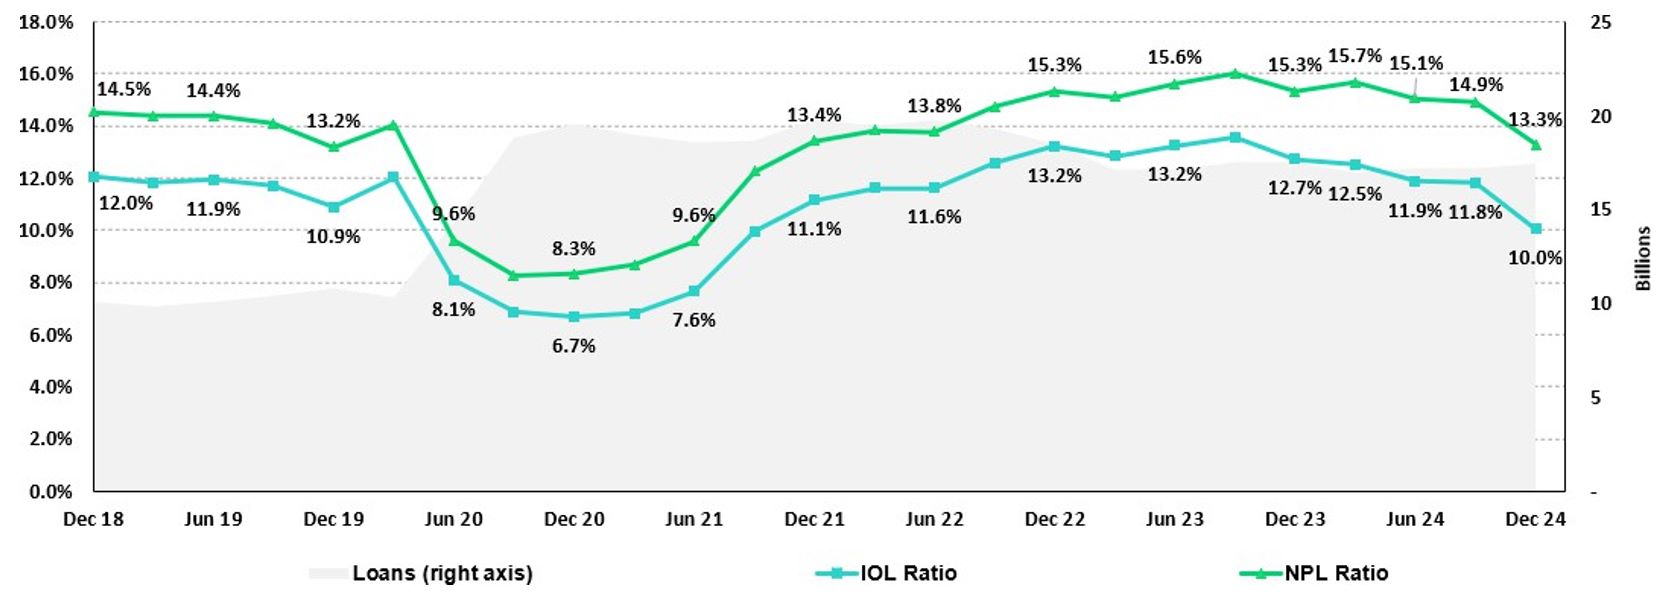
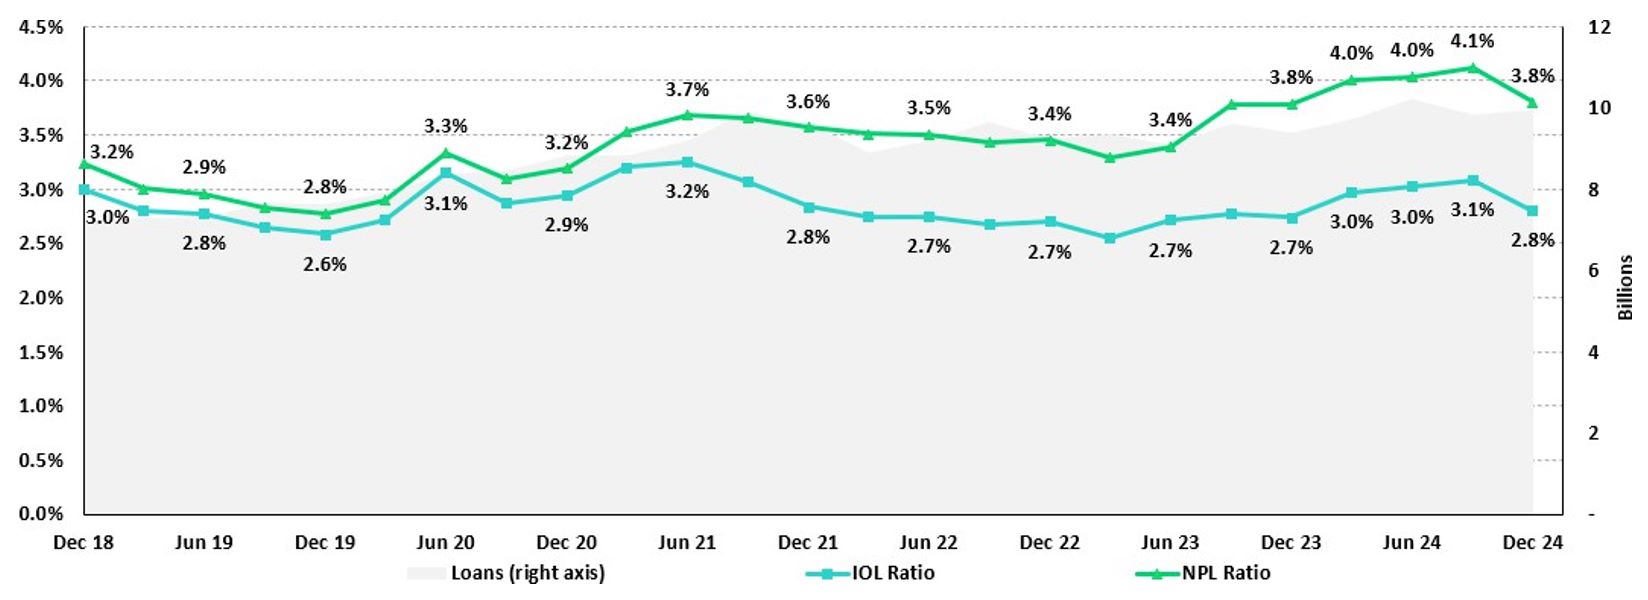
|
| |
Earnings Release
4Q / 2024
|
Analysis of 4Q24 Consolidated Results
|
|
12. Appendix
|
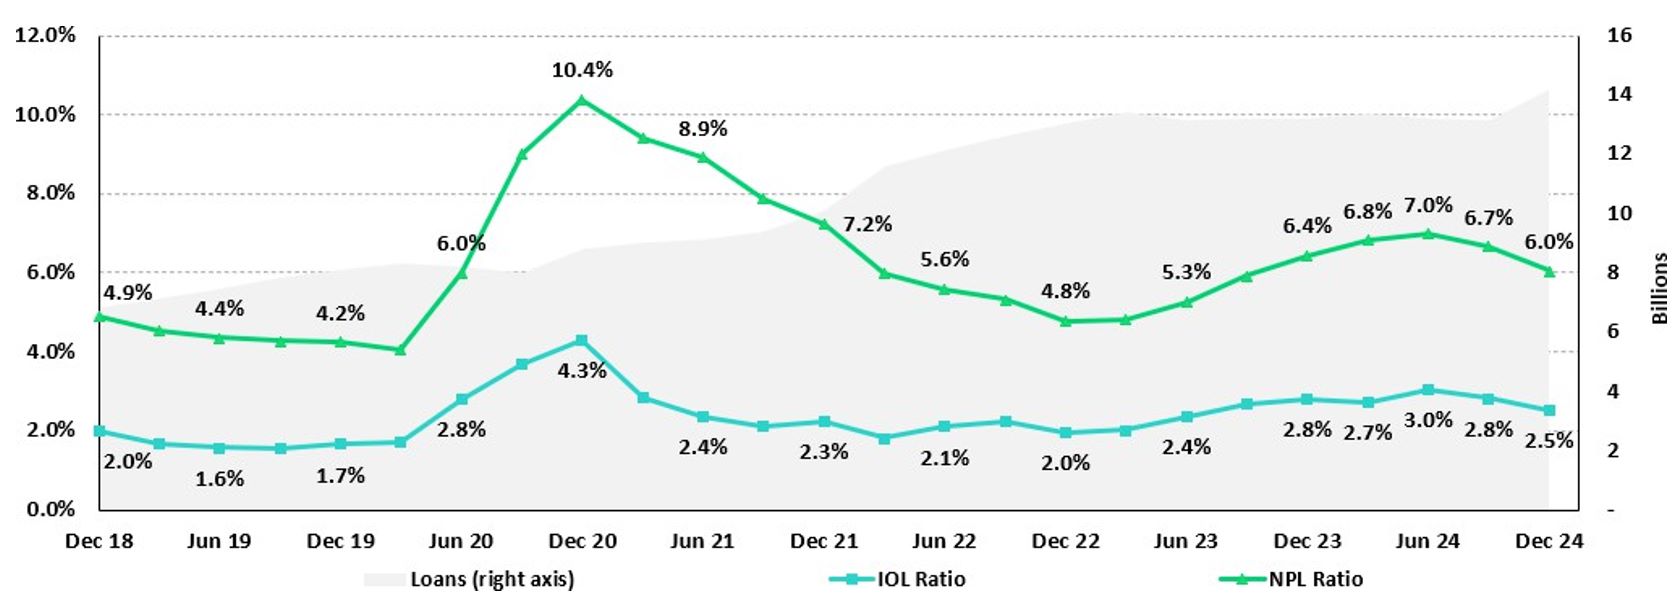
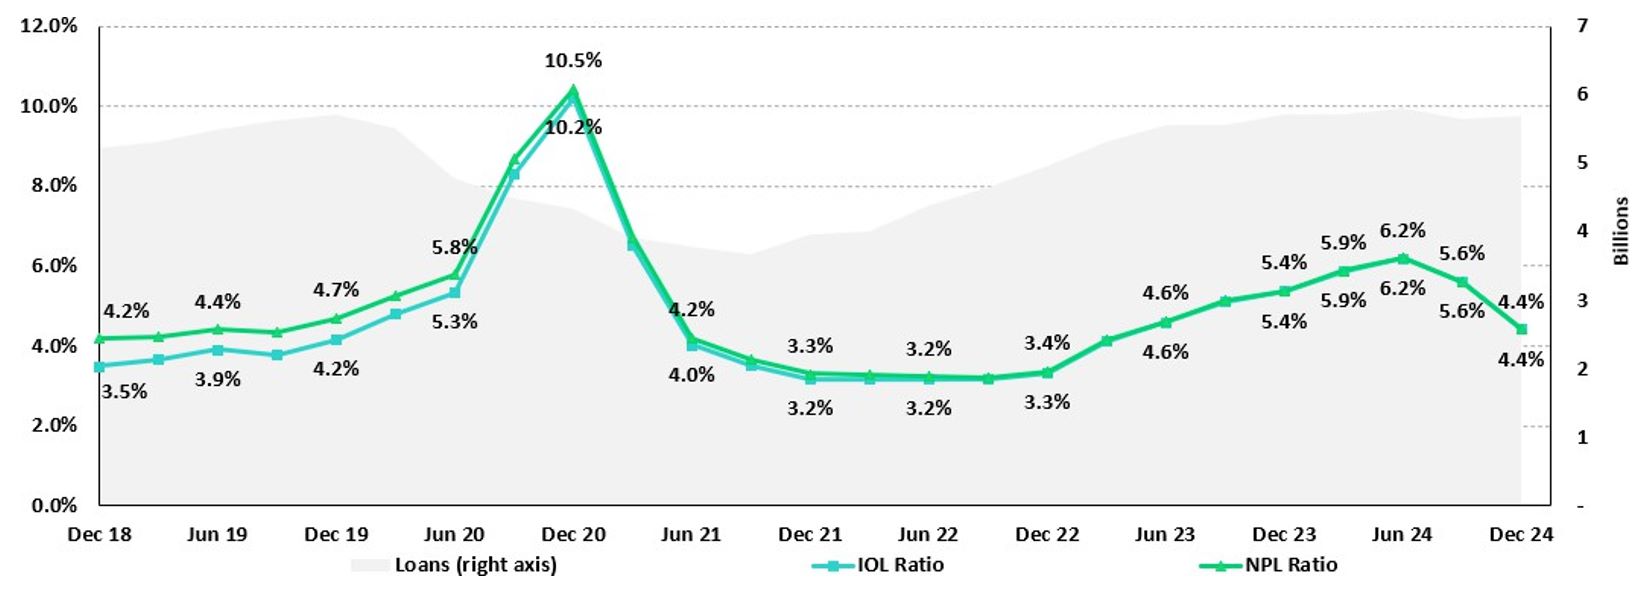
|
| |
Earnings
Release 4Q / 2024
|
Analysis of 4Q24
Consolidated Results
|
|
12. Appendix
|
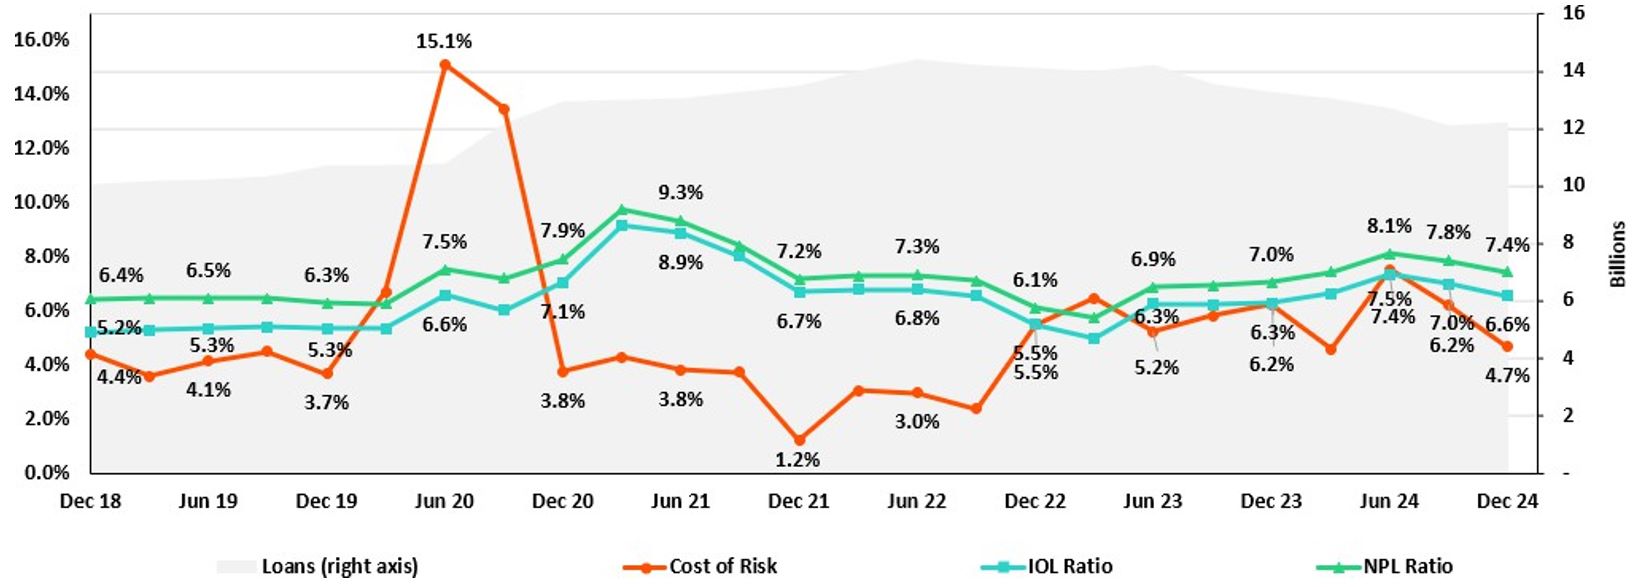
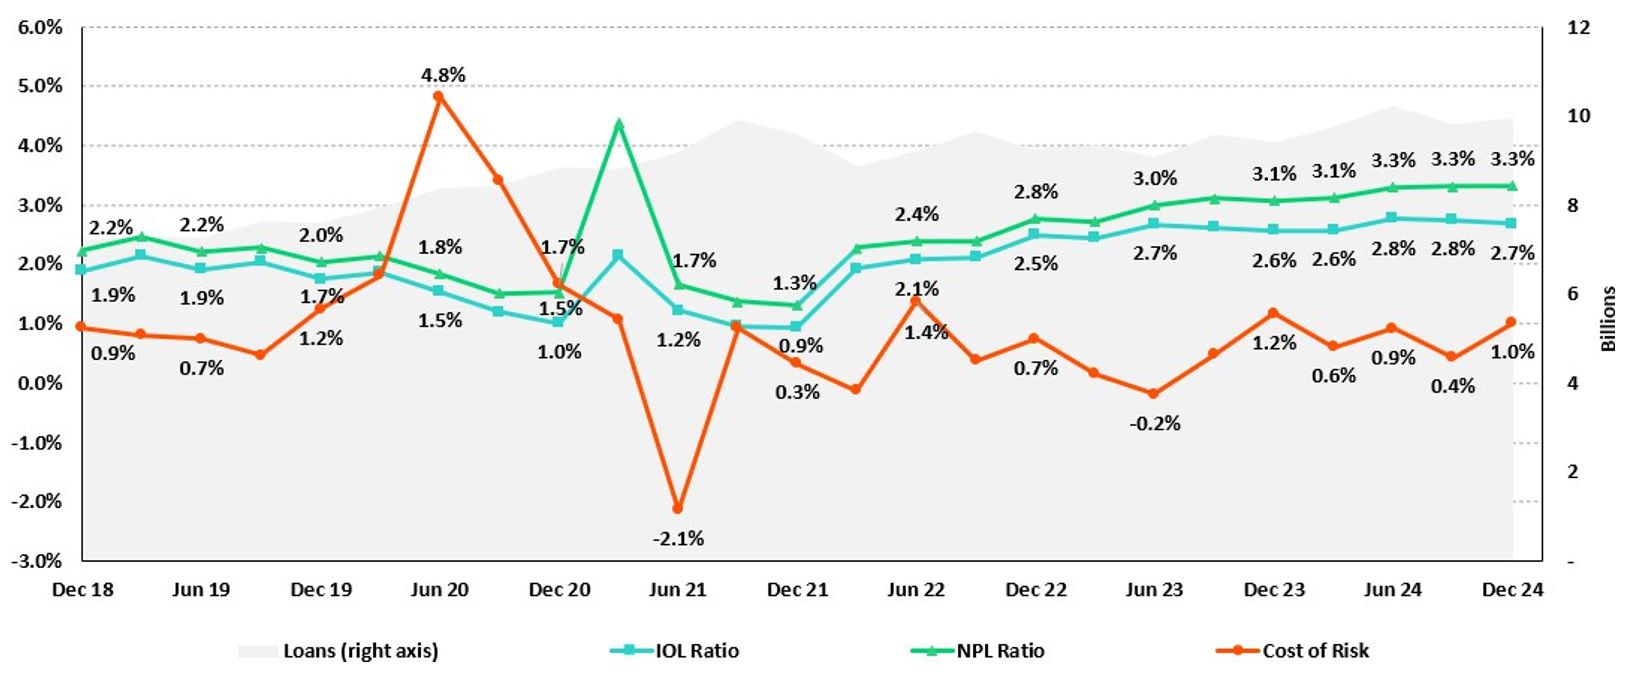
|
| |
Earnings
Release 4Q / 2024
|
Analysis of 4Q24
Consolidated Results
|
|
12.
Appendix
|
|
Net
interest income
|
Quarter
|
% change
|
Up to
|
% change
|
||||
|
S/000
|
4Q23
|
3Q24
|
4Q24
|
QoQ
|
YoY
|
Dec 23
|
Dec 24
|
Dec 24 / Dec 23
|
|
Interest
income
|
4,870,042
|
4,995,971
|
5,012,121
|
0.3%
|
2.9%
|
18,798,495
|
19,869,256
|
5.7%
|
|
Interest
on loans
|
3,907,705
|
3,924,222
|
3,940,002
|
0.4%
|
0.8%
|
15,044,864
|
15,654,391
|
4.1%
|
|
Dividends
on investments
|
11,647
|
13,187
|
15,285
|
15.9%
|
31.2%
|
46,080
|
49,469
|
7.4%
|
|
Interest
on deposits with banks
|
279,446
|
365,361
|
386,205
|
5.7%
|
38.2%
|
1,133,211
|
1,405,854
|
24.1%
|
|
Interest
on securities
|
643,737
|
667,195
|
652,155
|
-2.3%
|
1.3%
|
2,489,327
|
2,660,322
|
6.9%
|
|
Other
interest income
|
27,507
|
26,006
|
18,474
|
-29.0%
|
-32.8%
|
85,013
|
99,220
|
16.7%
|
|
Interest
expense
|
1,522,358
|
1,405,221
|
1,382,327
|
-1.6%
|
-9.2%
|
5,860,523
|
5,754,125
|
-1.8%
|
|
Interest expense (excluding
Net Insurance Financial Expenses)
|
1,402,925
|
1,276,643
|
1,250,239
|
-2.1%
|
-10.9%
|
5,393,709
|
5,246,769
|
-2.7%
|
|
Interest
on deposits
|
827,124
|
677,509
|
655,429
|
-3.3%
|
-20.8%
|
3,141,307
|
2,850,474
|
-9.3%
|
|
Interest
on borrowed funds
|
297,260
|
262,319
|
286,638
|
9.3%
|
-3.6%
|
1,158,666
|
1,081,126
|
-6.7%
|
|
Interest
on bonds and subordinated notes
|
152,960
|
200,801
|
201,053
|
0.1%
|
31.4%
|
634,299
|
799,223
|
26.0%
|
|
Other
interest expense
|
125,581
|
136,014
|
107,119
|
-21.2%
|
-14.7%
|
459,437
|
515,946
|
12.3%
|
|
Net Insurance Financial
Expenses
|
119,433
|
128,578
|
132,088
|
2.7%
|
10.6%
|
466,814
|
507,356
|
8.7%
|
|
Net
interest income
|
3,347,684
|
3,590,750
|
3,629,794
|
1.1%
|
8.4%
|
12,937,972
|
14,115,131
|
9.1%
|
|
Risk-adjusted
Net interest income
|
2,174,230
|
2,722,669
|
2,886,498
|
6.0%
|
32.8%
|
9,315,627
|
10,595,684
|
13.7%
|
|
Average interest earning
assets
|
223,624,217
|
231,316,507
|
237,518,087
|
2.7%
|
6.2%
|
223,318,737
|
232,646,024
|
4.2%
|
|
Net
interest margin (1)
|
6.20%
|
6.43%
|
6.34%
|
-9 bps
|
14 bps
|
6.00%
|
6.29%
|
29 bps
|
|
Risk-adjusted
Net interest margin (1)
|
4.10%
|
4.93%
|
5.08%
|
15 bps
|
98 bps
|
4.38%
|
4.77%
|
39 bps
|
|
Net
provisions for loan losses / Net interest income
|
35.05%
|
24.18%
|
20.48%
|
-370 bps
|
-1457 bps
|
28.00%
|
24.93%
|
-307 bps
|
|
NIM Breakdown
|
BCP Stand-alone
|
Mibanco
|
BCP Bolivia
|
Credicorp
|
|
4Q23
|
5.99%
|
13.35%
|
2.87%
|
6.20%
|
|
3Q24
|
6.17%
|
13.86%
|
2.95%
|
6.43%
|
|
4Q24
|
6.01%
|
14.16%
|
2.96%
|
6.34%
|
|
Risk-Adjusted
NIM
Breakdown
|
BCP
Stand-alone
|
Mibanco
|
BCP
Bolivia
|
Credicorp
|
|
4Q23
|
3.96%
|
8.17%
|
1.93%
|
4.10%
|
|
3Q24
|
4.75%
|
9.12%
|
2.59%
|
4.93%
|
|
4Q24
|
4.85%
|
10.66%
|
2.12%
|
5.08%
|
|
| |
Earnings
Release 4Q / 2024
|
Analysis
of 4Q24 Consolidated Results
|
|
Regulatory Capital and Capital
Adequacy Ratios
|
As
of
|
%
Change
|
|
|
S/000
|
Sep
24
|
Dec
24
|
QoQ
|
|
Capital Stock
|
1,318,993
|
1,318,993
|
-
|
|
Treasury Stocks
|
(208,901)
|
(208,879)
|
0.0%
|
|
Capital Surplus
|
179,027
|
176,307
|
-1.5%
|
|
Legal and Other
Capital reserves
|
27,187,346
|
27,202,665
|
0.1%
|
|
Minority interest
|
479,027
|
467,916
|
-2.3%
|
|
Current and
Accumulated Earnings (1)
|
5,432,237
|
6,592,462
|
21.4%
|
|
Unrealized Gains or
Losses (2)
|
(227,247)
|
(504,016)
|
121.8%
|
|
Goodwill
|
(734,431)
|
(722,361)
|
-1.6%
|
|
Intangible Assets
(3)
|
(2,050,646)
|
(2,396,687)
|
16.9%
|
|
Deductions in
Common Equity Tier 1 instruments (4)
|
(678,924)
|
(673,952)
|
-0.7%
|
|
Perpetual
subordinated debt
|
-
|
-
|
-
|
|
Subordinated Debt
|
7,939,610
|
8,047,314
|
1.4%
|
|
Loan loss reserves
(5)
|
1,967,574
|
2,033,379
|
3.3%
|
|
Deductions in Tier
2 instruments (6)
|
(1,525,608)
|
(1,322,352)
|
-13.3%
|
|
Total Regulatory Capital (A)
|
39,078,056
|
40,010,790
|
2.4%
|
|
Total Regulatory Common Equity
Tier 1 Capital (B)
|
30,696,480
|
31,252,448
|
1.8%
|
|
Total Regulatory Tier 1 Capital
(C)
|
30,696,480
|
31,252,448
|
1.8%
|
|
Total Regulatory Capital
Requirement (D)
|
27,276,454
|
29,124,775
|
6.8%
|
|
Total Regulatory Common Equity Tier
1 Capital Requirement (E)
|
13,968,158
|
15,445,079
|
10.6%
|
|
Total Regulatory Tier 1 Capital
Requirement (F)
|
17,131,013
|
18,681,850
|
9.1%
|
|
Regulatory Capital Ratio (A) /
(D)
|
1.43
|
1.37
|
-6
bps
|
|
Regulatory Common Equity Tier 1
Capital Ratio (B) / (E)
|
2.20
|
2.02
|
-17
bps
|
|
Regulatory Tier 1 Capital Ratio
(C) / (F)
|
1.79
|
1.67
|
-12
bps
|
|
(1)
|
Earnings include Banco de
Crédito del Perú and Mibanco Perú.
Losses include all subsidiaries.
|
|
(2)
|
Gains include Investment
Grade Government Bonds and Peruvian
Central Bank Certificates of
Deposits. Losses include all bonds.
|
|
(3)
|
Different to Goodwill.
Includes Diferred Tax Assets.
|
|
(4)
|
Investments in Equity.
|
|
(5)
|
Up to 1.25% of total
risk-weighted assets of Banco de
Crédito del Perú, Solución Empresa
Administradora Hipotecaria, Mibanco
and Atlantic Security Bank.
|
|
(6)
|
Investments in Tier 2
Subordinated Debt.
|
|
| |
Earnings Release 4Q / 2024
|
Analysis
of 4Q24 Consolidated Results
|
|
Regulatory
Capital
|
Quarter
|
Change %
|
|||
|
(S/ thousand)
|
Dec 23
|
Sep 24
|
Dec 24
|
QoQ
|
YoY |
|
Capital Stock
|
12,973,175
|
12,973,175
|
12,973,175
|
0.0%
|
0.0%
|
|
Reserves
|
6,590,921
|
6,591,330
|
6,124,302
|
-7.1%
|
-7.1%
|
|
Accumulated earnings
|
5,383,865
|
5,426,132
|
6,589,252
|
21.4%
|
22.4%
|
|
Loan loss reserves (1)
|
1,695,577
|
1,689,307
|
1,757,256
|
4.0%
|
3.6%
|
|
Subordinated Debt
|
5,007,150
|
7,232,550
|
7,339,800
|
1.5%
|
46.6%
|
|
Unrealized Profit or Losses
|
(668,717)
|
(322,210)
|
(413,658)
|
28.4%
|
-38.1%
|
|
Investment in subsidiaries
and others, net of unrealized
profit and net income in
subsidiaries
|
(2,772,786)
|
(2,537,005)
|
(2,477,732)
|
-2.3%
|
-10.6%
|
|
Intangibles
|
(1,294,279)
|
(1,330,135)
|
(1,515,214)
|
13.9%
|
17.1%
|
|
Goodwill
|
(122,083)
|
(122,083)
|
(122,083)
|
0.0%
|
0.0%
|
|
Total
Regulatory Capital
|
26,792,823
|
29,601,060
|
30,255,097
|
2.2%
|
12.9%
|
|
Tier 1
Common Equity (2)
|
20,090,096
|
20,679,203
|
21,158,042
|
2.3%
|
5.3%
|
|
Regulatory
Tier 1 Capital (3)
|
20,090,096
|
20,679,203
|
21,158,042
|
2.3%
|
5.3%
|
|
Regulatory
Tier 2 Capital (4)
|
6,702,727
|
8,921,857
|
9,097,056
|
2.0%
|
35.7%
|
|
Total
risk-weighted assets
|
Quarter
|
Change %
|
|||
|
(S/
thousand)
|
Dec 23
|
Sep 24
|
Dec 24
|
QoQ
|
YoY
|
|
Market risk-weighted assets
|
2,680,010
|
4,301,156
|
3,922,295
|
-8.8%
|
46.4%
|
|
Credit
risk-weighted assets
|
134,427,146
|
133,937,442
|
139,402,972
|
4.1%
|
3.7%
|
|
Operational risk-weighted
assets
|
16,365,974
|
17,871,737
|
18,409,113
|
3.0%
|
12.5%
|
|
Total
|
153,473,130
|
156,110,335
|
161,734,381
|
3.6%
|
5.4%
|
|
Capital
requirement
|
Quarter
|
Change %
|
|||
| (S/ thousand) |
Dec 23
|
Sep 24 |
Dec 24
|
QoQ | YoY |
|
Market risk capital
requirement
|
268,001
|
430,116
|
392,230
|
-8.8%
|
46.4%
|
|
Credit
risk capital requirement
|
12,098,443
|
12,724,057
|
13,243,282
|
4.1%
|
9.5%
|
|
Operational risk capital
requirement
|
1,636,597
|
1,787,174
|
1,840,911
|
3.0%
|
12.5%
|
|
Additional capital
requirements
|
5,383,837
|
5,647,686
|
6,882,642
|
21.9%
|
27.8%
|
|
Total
|
19,386,878
|
20,589,033
|
22,359,066
|
8.6%
|
15.3%
|
|
Capital ratios
under Local Regulation
|
Quarter
|
Dec 24
|
|
% Change
|
|
|
Dec 23
|
Sep 24 | QoQ |
YoY
|
||
|
Common Equity
Tier 1 ratio
|
13.09%
|
13.25%
|
13.08%
|
-16 bps
|
-1 bps
|
|
Tier 1 Capital
ratio
|
13.09%
|
13.25%
|
13.08%
|
-16 bps
|
-1 bps
|
|
Regulatory
Global Capital ratio
|
17.46%
|
18.96%
|
18.71%
|
-25 bps
|
125 bps
|
| [1] |
Up to 1.25% of total
risk-weighted assets.
|
| [2] | Common Equity Tier 1 = Capital Stock + Reserves + Accumulated earnings – Unrealized profits or losses - 100% deductions (investment in subsidiaries, goodwill, intangible assets and deferred tax assets based on future returns). |
| [3] |
Regulatory Tier 1 Capital =
Common Equity Tier 1 + Tier 1
Subordinated Debt (Perpetual).
|
| [4] |
Regulatory Tier 2 Capital =
Subordinated Debt + Loan loss
reserves.
|
|
| |
Earnings Release 4Q /
2024
|
Analysis of 4Q24
Consolidated Results
|
|
Regulatory
Capital
|
Quarter
|
Dec
24
|
|
% Change
|
|
| (S/ thousand) |
Dec 23
|
Sep 24
|
QoQ
|
YoY | |
|
Capital
Stock
|
1,840,606
|
1,840,606
|
1,840,606
|
0.0%
|
0.0%
|
|
Reserves
|
308,056
|
334,650
|
334,650
|
0.0%
|
8.6%
|
|
Accumulated
earnings
|
717,919
|
424,627
|
369,573
|
-13.0%
|
-48.5%
|
|
Loan
loss reserves (1)
|
163,158
|
143,193
|
144,751
|
1.1%
|
-11.3%
|
|
Perpetual subordinated debt
|
-
|
-
|
-
|
n.a
|
n.a. |
|
Subordinated
debt
|
173,000
|
167,000
|
167,000
|
0.0%
|
-3.5%
|
|
Unrealidez
Profit or Losses
|
4,252
|
6,366
|
(3,728)
|
-158.6%
|
-187.7%
|
|
Investment in subsidiaries
and others, net of unrealized profit
and net income in subsidiaries
|
(282)
|
(293)
|
(298)
|
1.8%
|
5.6%
|
|
Intangibles
|
(156,884)
|
(128,688)
|
(136,691)
|
6.2%
|
-12.9%
|
|
Goodwill
|
(139,180)
|
(139,180)
|
(139,180)
|
0.0%
|
0.0%
|
|
Total Regulatory
Capital
|
2,910,644
|
2,648,281
|
2,576,683
|
-2.7%
|
-11.5%
|
|
Tier Common
Equity (2)
|
2,574,486
|
2,338,088
|
2,264,932
|
-3.1%
|
-12.0%
|
|
Regulatory Tier
1 Capital (3)
|
2,574,486
|
2,338,088
|
2,264,932
|
-3.1%
|
-12.0%
|
|
Regulatory Tier
2 Capital (4)
|
336,158
|
310,193
|
311,751
|
0.5%
|
-7.3%
|
|
Total
risk-weighted assets
|
Quarter
|
|
% change
|
|||
| (S/ thousand) |
Dec
23
|
Sep
24
|
Dec
24
|
QoQ |
YoY
|
|
|
Market risk-weighted assets
|
220,327
|
238,117
|
241,964
|
1.6%
|
9.8%
|
|
|
Credit
risk-weighted assets
|
12,349,400
|
11,263,844
|
11,419,696
|
1.4%
|
-7.5%
|
|
|
Operational risk-weighted
assets
|
1,527,140
|
1,594,338
|
1,605,950
|
0.7%
|
5.2%
|
|
|
Total
|
14,096,867
|
13,096,299
|
13,267,611
|
1.3%
|
-5.9%
|
|
|
Capital
requirement
|
Quarter
|
|
% change
|
|||
|
(S/
thousand)
|
Dec
23
|
Sep 24
|
Dec
24
|
QoQ
|
YoY
|
|
|
Market
risk capital requirement
|
22,033
|
23,812
|
24,196
|
1.6%
|
9.8%
|
|
|
Credit risk capital
requirement
|
1,111,446
|
1,070,065
|
1,084,871
|
1.4%
|
-2.4%
|
|
|
Operational
risk capital requirement
|
152,714
|
159,434
|
160,595
|
0.7%
|
5.2%
|
|
|
Additional capital
requirements
|
166,717
|
160,510
|
184,428
|
14.9%
|
10.6%
|
|
|
Total
|
1,452,910
|
1,413,821
|
1,454,091
|
2.8%
|
0.1%
|
|
|
Capital ratios
under Local Regulation
|
Dec
23
|
Quarter
|
Dec
24
|
% change
|
|
|
Sep 24
|
QoQ | YoY | |||
|
Common Equity
Tier 1 Ratio
|
18.26%
|
17.85%
|
17.07%
|
-78
bps
|
-119
pbs
|
|
Tier 1 Capital
ratio
|
18.26%
|
17.85%
|
17.07%
|
-78
bps
|
-119
pbs
|
|
Regulatory
Global Capital Ratio
|
20.65%
|
20.22%
|
19.42%
|
-80
bps
|
-123
pbs
|
| [1] |
Up to 1.25% of total
risk-weighted assets.
|
| [2] | Common Equity Tier 1 = Capital Stock + Reserves + Accumulated earnings – Unrealized profits or losses - 100% deductions (investment in subsidiaries, goodwill, intangible assets and deferred tax assets based on future returns). |
| [3] |
Regulatory Tier 1 Capital =
Common Equity Tier 1 + Tier 1
Subordinated Debt (Perpetual).
|
| [4] |
Regulatory Tier 2 Capital =
Subordinated Debt + Loan loss
reserves.
|
|
| |
Earnings Release 4Q /
2024
|
Analysis of 4Q24
Consolidated Results
|
|
Common
Equity Tier 1 IFRS
|
|
Quarter
|
|
% Change
|
|
|
(S/. thousand)
|
Dec 23
|
Sep 24
|
Dec 24
|
QoQ | YoY |
|
Capital
and reserves
|
19,051,853
|
19,052,262
|
18,585,234
|
-2.5%
|
-2.4%
|
|
Retained
earnings
|
6,058,923
|
6,076,551
|
7,345,245
|
20.9%
|
21.2%
|
|
Unrealized
gains (losses)
|
(109,202)
|
222,730
|
81,399
|
-63.5%
|
-174.5%
|
|
Goodwill
and intangibles
|
(1,670,116)
|
(1,599,568)
|
(1,741,267)
|
8.9%
|
4.3%
|
|
Investments
in subsidiaries
|
(2,917,670)
|
(2,669,334)
|
(2,598,905)
|
-2.6%
|
-10.9%
|
|
Total
|
20,413,787
|
21,082,641
|
21,671,706
|
2.8%
|
6.2%
|
|
Adjusted
RWAs IFRS
|
154,627,042
|
157,046,547
|
162,676,386
|
3.6%
|
3.5%
|
|
Adjusted Credit RWAs IFRS
|
135,581,058
|
134,873,654
|
140,344,978
|
4.1%
|
3.5%
|
|
Others
|
19,045,984
|
22,172,893
|
22,331,409
|
0.7%
|
17.2%
|
|
CET1
ratio IFRS
|
13.20%
|
13.42% | 13.32% |
-10 bps
|
12 bps |
|
Common Equity
Tier 1 IFRS
|
|
Quarter
|
|
%
change
|
|
|
(S/.
thousand)
|
Dec
23
|
Sep 24
|
Dec
24
|
QoQ | YoY |
|
Capital
and reserves
|
2,676,791
|
2,703,385
|
2,703,385
|
0.0%
|
1.0%
|
|
Retained earnings
|
321,235
|
36,907
|
(29,980)
|
-181.2%
|
-109.3%
|
|
Unrealized
gains (losses)
|
(1,403)
|
3,081
|
(5,037)
|
-263.5%
|
258.9%
|
|
Goodwill and intangibles
|
(360,171)
|
(303,850)
|
(310,730)
|
2.3%
|
-13.7%
|
|
Investments
in subsidiaries
|
(271)
|
(296)
|
(302)
|
2.0%
|
11.6%
|
|
Total
|
2,636,182
|
2,439,227
|
2,357,337
|
-3.4%
|
-10.6%
|
|
Adjusted RWAs
IFRS
|
14,349,534
|
13,291,063
|
13,449,807
|
1.2%
|
-6.3%
|
|
Adjusted
Credit RWAs IFRS
|
12,595,184
|
11,455,585
|
11,597,881
|
1.2%
|
-7.9%
|
|
Others
|
1,754,350
|
1,835,478
|
1,851,926
|
0.9%
|
5.6%
|
|
CET1 ratio IFRS
|
18.37%
|
18.35% | 17.53% |
-83 bps
|
-84 bps |
|
| |
Earnings Release 4Q /
2024
|
Analysis of 4Q24
Consolidated Results
|
|
Dec 23
|
As of
Sep 24
|
Dec 24
|
% change
QoQ YoY
|
||
|
ASSETS
|
|||||
|
Cash and due from
banks
|
|||||
|
Non-interest bearing
|
7,952,371
|
7,222,945
|
7,535,259
|
4.3%
|
-5.2%
|
|
Interest bearing
|
25,978,577
|
37,007,966
|
40,119,937
|
8.4%
|
54.4%
|
|
Total cash and due
from banks
|
33,930,948
|
44,230,911
|
47,655,196
|
7.7%
|
40.4%
|
|
Cash
collateral, reverse
repurchase agreements and
securities borrowing
|
1,410,647
|
1,419,305
|
1,033,177
|
-27.2%
|
-26.8%
|
|
Fair value
through profit or loss
investments
|
4,982,661
|
4,642,905
|
4,715,343
|
1.6%
|
-5.4%
|
|
Fair value
through other comprehensive
income investments
|
37,043,940
|
39,832,274
|
40,142,638
|
0.8%
|
8.4%
|
|
Amortized
cost investments
|
10,188,927
|
8,853,694
|
8,967,877
|
1.3%
|
-12.0%
|
|
Loans
|
144,976,051
|
142,568,785
|
145,732,273
|
2.2%
|
0.5%
|
|
Current
|
138,849,564
|
136,542,444
|
140,309,061
|
2.8%
|
1.1%
|
|
Internal overdue loans
|
6,126,487
|
6,026,341
|
5,423,212
|
-10.0%
|
-11.5%
|
|
Less - allowance for
loan losses
|
(8,277,916)
|
(8,250,023)
|
(7,994,977)
|
-3.1%
|
-3.4%
|
|
Loans, net
|
136,698,135
|
134,318,762
|
137,737,296
|
2.5%
|
0.8%
|
|
Financial
assets designated at fair
value through profit or loss
|
810,932
|
900,107
|
932,734
|
3.6%
|
15.0%
|
|
Property,
plant and equipment, net
|
1,857,240
|
1,836,732
|
1,841,147
|
0.2%
|
-0.9%
|
|
Due from
customers on acceptances
|
412,401
|
466,957
|
528,184
|
13.1%
|
28.1%
|
|
Investments
in associates
|
748,663
|
729,770
|
763,918
|
4.7%
|
2.0%
|
|
Intangible
assets and goodwill, net
|
3,225,499
|
3,167,296
|
3,289,157
|
3.8%
|
2.0%
|
|
Reinsurance
contract assets
|
872,046
|
880,563
|
841,170
|
-4.5%
|
-3.5%
|
|
Other
assets (1)
|
6,658,149
|
8,480,514
|
7,749,647
|
-8.6%
|
16.4%
|
|
Total
Assets
|
238,840,188
|
249,759,790
|
256,197,484
|
2.6%
|
7.3%
|
|
LIABILITIES AND
EQUITY
|
|||||
|
Deposits and
obligations
|
|||||
|
Non-interest bearing
|
42,234,498
|
47,436,563
|
47,160,191
|
-0.6%
|
11.7%
|
|
Interest bearing
|
105,470,496
|
106,998,888
|
114,681,875
|
7.2%
|
8.7%
|
|
Total deposits and
obligations
|
147,704,994
|
154,435,451
|
161,842,066
|
4.8%
|
9.6%
|
|
Payables
from repurchase agreements
and securities lending
|
10,168,427
|
7,383,104
|
9,060,710
|
22.7%
|
-10.9%
|
|
BCRP
instruments
|
7,461,674
|
4,788,939
|
6,646,830
|
38.8%
|
-10.9%
|
|
Repurchase
agreements with third
parties
|
2,608,631
|
2,517,833
|
2,298,494
|
-8.7%
|
-11.9%
|
|
Repurchase
agreements with customers
|
98,122
|
76,332
|
115,386
|
51.2%
|
17.6%
|
|
Due to
banks and correspondents
|
12,278,681
|
12,704,234
|
10,754,385
|
-15.3%
|
-12.4%
|
|
Bonds and
notes issued
|
14,594,785
|
16,952,011
|
17,268,443
|
1.9%
|
18.3%
|
|
Banker’s
acceptances outstanding
|
412,401
|
466,957
|
528,184
|
13.1%
|
28.1%
|
|
Insurance
contract liability
|
12,318,133
|
13,289,394
|
13,422,285
|
1.0%
|
9.0%
|
|
Financial
liabilities at fair value
through profit or loss
|
641,915
|
698,747
|
151,485
|
-78.3%
|
-76.4%
|
|
Other
liabilities
|
7,613,787
|
9,752,701
|
8,192,692
|
-16.0%
|
7.6%
|
|
Total Liabilities
|
205,733,123
|
215,682,599
|
221,220,250
|
2.6%
|
7.5%
|
|
Net equity
|
32,460,004
|
33,462,591
|
34,346,451
|
2.6%
|
5.8%
|
|
Capital
stock
|
1,318,993
|
1,318,993
|
1,318,993
|
0.0%
|
0.0%
|
|
Treasury
stock
|
(208,033)
|
(208,901)
|
(208,879)
|
0.0%
|
0.4%
|
|
Capital
surplus
|
228,239
|
179,027
|
176,307
|
-1.5%
|
-22.8%
|
|
Reserves
|
26,252,578
|
27,187,346
|
27,202,665
|
0.1%
|
3.6%
|
|
Other
reserves
|
295,783
|
470,550
|
214,627
|
-54.4%
|
-27.4%
|
|
Retained
earnings
|
4,572,444
|
4,515,576
|
5,642,738
|
25.0%
|
23.4%
|
|
Non-controlling
interest
|
647,061
|
614,600
|
630,783
|
2.6%
|
-2.5%
|
|
Total Net Equity
|
33,107,065
|
34,077,191
|
34,977,234
|
2.6%
|
5.6%
|
|
Total liabilities and
equity
|
238,840,188
|
249,759,790
|
256,197,484
|
2.6%
|
7.3%
|
|
Off-balance sheet
|
149,769,480
|
155,876,986
|
151,223,851
|
-3.0%
|
1.0%
|
|
Total
performance bonds, stand-by
and L/Cs.
|
20,051,616
|
20,206,333
|
22,139,322
|
9.6%
|
10.4%
|
|
Undrawn
credit lines, advised but
not committed
|
87,091,701
|
88,226,431
|
85,269,774
|
-3.4%
|
-2.1%
|
|
Total
derivatives (notional) and
others
|
42,626,163
|
47,444,222
|
43,814,755
|
-7.6%
|
2.8%
|
|
| |
Earnings
Release 4Q / 2024
|
Analysis
of 4Q24 Consolidated
Results
|
|
Quarter
|
%
change
|
As
of
|
%
change
|
||||||
|
4Q23
|
3Q24
|
4Q24
|
QoQ
|
YoY
|
Dec
23
|
Dec
24
|
Dec
24 / Dec 23
|
||
|
Interest
income and expense
|
|||||||||
|
Interest
and similar income
|
4,870,042
|
4,995,971
|
5,012,121
|
0.3%
|
2.9%
|
18,798,495
|
19,869,256
|
5.7%
|
|
|
Interest
and similar expenses
|
(1,522,358)
|
(1,405,221)
|
(1,382,327)
|
-1.6%
|
-9.2%
|
(5,860,523)
|
(5,754,125)
|
-1.8%
|
|
|
Net
interest, similar income
and expenses
|
3,347,684
|
3,590,750
|
3,629,794
|
1.1%
|
8.4%
|
12,937,972
|
14,115,131
|
9.1%
|
|
|
Gross
provision for credit
losses on loan portfolio
|
(1,260,163)
|
(981,870)
|
(857,694)
|
-12.6%
|
-31.9%
|
(3,957,143)
|
(3,943,301)
|
-0.3%
|
|
|
Recoveries
of written-off loans
|
86,709
|
113,789
|
114,398
|
0.5%
|
31.9%
|
334,798
|
423,854
|
26.6%
|
|
|
Provision
for credit losses on
loan portfolio, net of
recoveries
|
(1,173,454)
|
(868,081)
|
(743,296)
|
-14.4%
|
-36.7%
|
(3,622,345)
|
(3,519,447)
|
-2.8%
|
|
|
Net
interest, similar income
and expenses, after
provision for credit
losses on loan portfolio
|
2,174,230
|
2,722,669
|
2,886,498
|
6.0%
|
32.8%
|
9,315,627
|
10,595,684
|
13.7%
|
|
|
Other
income
|
|||||||||
|
Fee
income
|
986,173
|
1,108,314
|
1,103,548
|
-0.4%
|
11.9%
|
3,804,459
|
4,423,193
|
16.3%
|
|
|
Net
gain on foreign exchange
transactions
|
218,047
|
172,998
|
223,913
|
29.4%
|
2.7%
|
886,126
|
781,076
|
-11.9%
|
|
|
Net
loss on securities
|
115,825
|
120,033
|
(47,377)
|
-139.5%
|
-140.9%
|
308,055
|
227,112
|
-26.3%
|
|
|
Net
gain from associates
|
34,132
|
35,600
|
38,560
|
8.3%
|
13.0%
|
117,089
|
135,183
|
15.5%
|
|
|
Net
gain (loss) on
derivatives held for
trading
|
5,019
|
93,801
|
188,301
|
100.7%
|
3651.8%
|
53,665
|
363,834
|
578.0%
|
|
|
Net
gain (loss) from
exchange differences
|
15,255
|
(6,139)
|
(21,365)
|
248.0%
|
-240.1%
|
45,778
|
(41,058)
|
-189.7%
|
|
|
Others
|
112,372
|
96,675
|
176,384
|
82.5%
|
57.0%
|
440,653
|
514,779
|
16.8%
|
|
|
Total
other income
|
1,486,823
|
1,621,282
|
1,661,964
|
2.5%
|
11.8%
|
5,655,825
|
6,404,119
|
13.2%
|
|
|
Insurance
underwriting result
|
385,043
|
419,805
|
407,149
|
-3.0%
|
5.7%
|
1,602,421
|
1,693,617
|
5.7%
|
|
|
Insurance
Service Result
|
(97,748)
|
(128,030)
|
(94,466)
|
-26.2%
|
-3.4%
|
(391,321)
|
(494,597)
|
26.4%
|
|
|
Reinsurance
Result
|
287,295
|
291,775
|
312,683
|
7.2%
|
8.8%
|
1,211,100
|
1,199,020
|
-1.0%
|
|
|
Total
insurance underwriting
result
|
|||||||||
|
Total
Expenses
|
(1,119,758)
|
(1,155,966)
|
(1,271,578)
|
10.0%
|
13.6%
|
(4,265,453)
|
(4,676,436)
|
9.6%
|
|
|
Salaries
and employee benefits
|
(1,089,203)
|
(1,047,386)
|
(1,230,099)
|
17.4%
|
12.9%
|
(3,803,203)
|
(4,183,775)
|
10.0%
|
|
|
Administrative,
general and tax expenses
|
(177,618)
|
(179,495)
|
(186,625)
|
4.0%
|
5.1%
|
(659,007)
|
(713,470)
|
8.3%
|
|
|
Depreciation
and amortization
|
(71,959)
|
(23,046)
|
(4,300)
|
-81.3%
|
-94.0%
|
(71,959)
|
(27,346)
|
-62.0%
|
|
|
Association
in participation
|
(9,109)
|
(6,414)
|
(3,808)
|
-40.6%
|
-58.2%
|
(53,097)
|
(28,269)
|
-46.8%
|
|
|
Other
expenses
|
(193,895)
|
(111,859)
|
(409,049)
|
265.7%
|
111.0%
|
(481,504)
|
(745,000)
|
54.7%
|
|
|
Total
expenses
|
(2,661,542)
|
(2,524,166)
|
(3,105,459)
|
23.0%
|
16.7%
|
(9,334,223)
|
(10,374,296)
|
11.1%
|
|
|
Profit
before income tax
|
1,286,806
|
2,111,560
|
1,755,686
|
-16.9%
|
36.4%
|
6,848,329
|
7,824,527
|
14.3%
|
|
|
Income
tax
|
(434,648)
|
(555,117)
|
(598,348)
|
7.8%
|
37.7%
|
(1,888,451)
|
(2,201,275)
|
16.6%
|
|
|
Net
profit
|
852,158
|
1,556,443
|
1,157,338
|
-25.6%
|
35.8%
|
4,959,878
|
5,623,252
|
13.4%
|
|
|
Non-controlling
interest
|
10,331
|
32,655
|
30,625
|
-6.2%
|
196.4%
|
94,338
|
121,998
|
29.3%
|
|
|
Net
profit attributable to
Credicorp
|
841,827
|
1,523,788
|
1,126,713
|
-26.1%
|
33.8%
|
4,865,540
|
5,501,254
|
13.1%
|
|
|
| |
Earnings
Release 4Q / 2024
|
Analysis of
4Q24 Consolidated
Results
|
|
As
of
|
%
change
|
||||
|
Dec
23
|
Sep
24
|
Dec
24
|
QoQ
|
YoY
|
|
|
ASSETS
|
|||||
|
Cash
and cash equivalents
|
529,773
|
594,754
|
399,943
|
-32.8%
|
-24.5%
|
|
At
fair value through
profit or loss
|
501,026
|
-
|
-
|
n.a.
|
n.a.
|
|
Fair
value through other
comprehensive income
investments
|
1,418,293
|
1,279,564
|
1,262,327
|
-1.3%
|
-11.0%
|
|
In
subsidiaries and
associates investments
|
36,150,565
|
37,481,263
|
38,291,133
|
2.2%
|
5.9%
|
|
Investments
at amortized cost
|
166,977
|
629,491
|
695,652
|
10.5%
|
316.6%
|
|
Other
assets
|
99
|
856,336
|
6,777
|
-99.2%
|
n.a.
|
|
Total
Assets
|
38,766,733
|
40,841,408
|
40,655,832
|
-0.5%
|
4.9%
|
|
LIABILITIES
AND NET SHAREHOLDERS'
EQUITY
|
|||||
|
Due
to banks, correspondents
and other entities
|
30,866
|
-
|
-
|
n.a.
|
n.a.
|
|
Bonds
and notes issued
|
1,798,858
|
1,814,219
|
1,829,657
|
0.9%
|
1.7%
|
|
Other
liabilities
|
255,707
|
1,294,018
|
230,660
|
-82.2%
|
-9.8%
|
|
Total
Liabilities
|
2,085,431
|
3,108,237
|
2,060,317
|
-33.7%
|
-1.2%
|
|
NET
EQUITY
|
|||||
|
Capital
stock
|
1,318,993
|
1,318,993
|
1,318,993
|
0.0%
|
0.0%
|
|
Capital
Surplus
|
384,542
|
384,542
|
384,542
|
0.0%
|
0.0%
|
|
Reserve
|
25,905,526
|
26,651,433
|
26,651,390
|
0.0%
|
2.9%
|
|
Unrealized
results
|
68,056
|
292,640
|
35,535
|
-87.9%
|
-47.8%
|
|
Retained
earnings
|
9,004,185
|
9,085,563
|
10,205,055
|
12.3%
|
13.3%
|
|
Total
net equity
|
36,681,302
|
37,733,171
|
38,595,515
|
2.3%
|
5.2%
|
|
Total
Liabilities And Equity
|
38,766,733
|
40,841,408
|
40,655,832
|
-0.5%
|
4.9%
|
|
Quarter
|
%
Change
|
Up
to
|
%
Change
|
|||||
|
4Q23
|
3Q24
|
4Q24
|
QoQ
|
YoY
|
Dec
23
|
Dec
24
|
Dec
24 / Dec 23
|
|
|
Interest
income
|
||||||||
|
Net
share of the income from
investments in
subsidiaries and
associates
|
906,901
|
1,735,379
|
1,121,288
|
-35.4%
|
23.6%
|
5,439,451
|
6,313,139
|
16.1%
|
|
Interest
and similar income
|
1,170
|
22,290
|
24,419
|
9.6%
|
n.a.
|
10,895
|
93,486
|
758.1%
|
|
Net
gain on financial assets
at fair value through
profit or loss
|
32,430
|
-
|
-
|
n.a.
|
n.a.
|
67,652
|
1,234
|
-98.2%
|
|
Total
income
|
940,501
|
1,757,669
|
1,145,707
|
-34.8%
|
21.8%
|
5,517,998
|
6,407,859
|
16.1%
|
|
Interest
and similar expense
|
(14,444)
|
(13,527)
|
(13,637)
|
0.8%
|
-5.6%
|
(56,276)
|
(54,237)
|
-3.6%
|
|
Administrative
and general expenses
|
(9,274)
|
(4,034)
|
(4,134)
|
2.5%
|
-55.4%
|
(25,362)
|
(18,085)
|
-28.7%
|
|
Total
expenses
|
(23,718)
|
(17,561)
|
(17,771)
|
1.2%
|
-25.1%
|
(81,638)
|
(72,322)
|
-11.4%
|
|
Operating
income
|
916,783
|
1,740,108
|
1,127,936
|
-35.2%
|
23.0%
|
5,436,360
|
6,335,537
|
16.5%
|
|
Results
from exchange
differences
|
510
|
(119)
|
175
|
n.a.
|
-65.7%
|
(1,549)
|
(2,681)
|
73.1%
|
|
Other,
net
|
111
|
(367)
|
(7)
|
n.a.
|
-106.3%
|
2,977
|
(292)
|
n.a.
|
|
Profit
before income tax
|
917,404
|
1,739,622
|
1,128,104
|
-35.2%
|
23.0%
|
5,437,788
|
6,332,564
|
16.5%
|
|
Income
tax
|
(68,500)
|
(43,118)
|
(8,612)
|
-80.0%
|
-87.4%
|
(209,238)
|
(146,713)
|
-29.9%
|
|
Net
income
|
848,904
|
1,696,504
|
1,119,492
|
-34.0%
|
31.9%
|
5,228,550
|
6,185,851
|
18.3%
|
|
Double
Leverage Ratio
|
98.6%
|
99.3%
|
99.2%
|
-12
bps
|
66
bps
|
98.6%
|
99.2%
|
66
bps
|
|
| |
Earnings
Release 4Q /
2024
|
Analysis
of 4Q24
Consolidated
Results
|
|
As of
|
% change
|
||||
|
Dec 23
|
Sep 24
|
Dec 24
|
QoQ
|
YoY
|
|
|
ASSETS
|
|||||
|
Cash
and due from banks
|
|||||
|
Non-interest
bearing
|
6,025,352
|
5,134,613
|
5,430,818
|
5.8%
|
-9.9%
|
|
Interest
bearing
|
24,668,794
|
36,092,693
|
39,106,465
|
8.4%
|
58.5%
|
|
Total cash
and due from banks
|
30,694,146
|
41,227,306
|
44,537,283
|
8.0%
|
45.1%
|
|
Cash
collateral,
reverse repurchase
agreements and
securities
borrowing
|
100,211
|
622,399
|
19,151
|
-96.9%
|
-80.9%
|
|
Fair value
through profit or
loss investments
|
362,360
|
704,968
|
603,635
|
-14.4%
|
66.6%
|
|
Fair value
through other
comprehensive
income investments
|
20,592,731
|
22,888,341
|
23,375,769
|
2.1%
|
13.5%
|
|
Amortized
cost investments
|
9,557,451
|
8,178,619
|
8,277,440
|
1.2%
|
-13.4%
|
|
Loans
|
131,767,137
|
129,063,925
|
132,053,791
|
2.3%
|
0.2%
|
|
Current
|
125,948,604
|
123,400,733
|
126,990,918
|
2.9%
|
0.8%
|
|
Internal
overdue loans
|
5,818,533
|
5,663,192
|
5,062,873
|
-10.6%
|
-13.0%
|
|
Less
- allowance for
loan losses
|
(7,772,720)
|
(7,714,711)
|
(7,443,523)
|
-3.5%
|
-4.2%
|
|
Loans,
net
|
123,994,417
|
121,349,214
|
124,610,268
|
2.7%
|
0.5%
|
|
Property,
furniture and
equipment, net (1)
|
1,559,485
|
1,479,708
|
1,496,066
|
1.1%
|
-4.1%
|
|
Due from
customers on
acceptances
|
412,401
|
466,957
|
528,184
|
13.1%
|
28.1%
|
|
Investments
in associates
|
21,426
|
29,053
|
29,368
|
1.1%
|
37.1%
|
|
Other
assets (2)
|
6,510,227
|
7,959,779
|
7,609,096
|
-4.4%
|
16.9%
|
|
Total
Assets
|
193,804,855
|
204,906,344
|
211,086,260
|
3.0%
|
8.9%
|
|
Liabilities
and Equity
|
|||||
|
Deposits
and obligations
|
|||||
|
Non-interest
bearing (1)
|
39,377,289
|
45,310,064
|
44,280,933
|
-2.3%
|
12.5%
|
|
Interest
bearing (1)
|
92,931,227
|
95,985,178
|
103,434,795
|
7.8%
|
11.3%
|
|
Total
deposits and
obligations
|
132,308,516
|
141,295,242
|
147,715,728
|
4.5%
|
11.6%
|
|
Payables
from repurchase
agreements and
securities lending
|
8,005,844
|
5,621,745
|
7,203,885
|
28.1%
|
-10.0%
|
|
BCRP
instruments
|
7,461,674
|
4,788,939
|
6,646,830
|
38.8%
|
-10.9%
|
|
Repurchase
agreements with
third parties
|
544,170
|
832,806
|
557,055
|
-33.1%
|
2.4%
|
|
Due to
banks and
correspondents
|
11,870,116
|
12,210,085
|
10,165,266
|
-16.7%
|
-14.4%
|
|
Bonds and
notes issued
|
10,961,427
|
13,351,992
|
13,627,208
|
2.1%
|
24.3%
|
|
Banker’s
acceptances
outstanding
|
412,401
|
466,957
|
528,184
|
13.1%
|
28.1%
|
|
Financial
liabilities at
fair value through
profit or loss
|
91,966
|
354,562
|
-
|
n.a.
|
n.a.
|
|
Other
liabilities (3)
|
4,995,178
|
6,110,653
|
5,694,394
|
-6.8%
|
14.0%
|
|
Total
Liabilities
|
168,645,448
|
179,411,236
|
184,934,665
|
3.1%
|
9.7%
|
|
Net equity
|
24,998,419
|
25,347,135
|
26,007,483
|
2.6%
|
4.0%
|
|
Capital
stock
|
12,679,794
|
12,679,794
|
12,679,794
|
0.0%
|
0.0%
|
|
Reserves
|
6,372,059
|
6,372,468
|
5,905,440
|
-7.3%
|
-7.3%
|
|
Unrealized
gains and losses
|
(108,012)
|
223,921
|
82,590
|
n.a.
|
n.a.
|
|
Retained
earnings
|
6,054,578
|
6,070,952
|
7,339,659
|
20.9%
|
21.2%
|
|
Non-controlling
interest
|
160,988
|
147,973
|
144,112
|
-2.6%
|
-10.5%
|
|
Total Net
Equity
|
25,159,407
|
25,495,108
|
26,151,595
|
2.6%
|
3.9%
|
|
Total
liabilities and
equity
|
193,804,855
|
204,906,344
|
211,086,260
|
3.0%
|
8.9%
|
|
Off-balance
sheet
|
138,140,917
|
144,241,520
|
139,066,953
|
-3.6%
|
0.7%
|
|
Total
performance bonds,
stand-by and L/Cs.
|
19,328,506
|
19,593,247
|
21,683,478
|
10.7%
|
12.2%
|
|
Undrawn
credit lines,
advised but not
committed
|
76,719,565
|
77,964,739
|
74,193,794
|
-4.8%
|
-3.3%
|
|
Total
derivatives
(notional) and
others
|
42,092,846
|
46,683,534
|
43,189,681
|
-7.5%
|
2.6%
|
|
| |
Earnings
Release 4Q / 2024
|
Analysis
of 4Q24 Consolidated
Results
|
|
Quarter
|
%
change
|
As
of
|
%
Change
|
|||||
|
4Q23
|
3Q24
|
4Q24
|
QoQ
|
YoY
|
Dec
23
|
Dec
24
|
Dec
24 / Dec 23
|
|
|
Interest
income and expense
|
||||||||
|
Interest
and similar income
|
4,265,959
|
4,363,712
|
4,381,994
|
0.4%
|
2.7%
|
16,463,174
|
17,346,146
|
5.4%
|
|
Interest
and similar expenses (1)
|
(1,153,770)
|
(1,040,332)
|
(1,025,087)
|
-1.5%
|
-11.2%
|
(4,477,974)
|
(4,286,492)
|
-4.3%
|
|
Interest
income and expense
|
3,112,189
|
3,323,380
|
3,356,907
|
1.0%
|
7.9%
|
11,985,200
|
13,059,654
|
9.0%
|
|
Provision
for credit losses on
loan portfolio
|
(1,160,527)
|
(935,374)
|
(786,209)
|
-15.9%
|
-32.3%
|
(3,768,729)
|
(3,683,332)
|
-2.3%
|
|
Recoveries
of written-off loans
|
81,398
|
107,848
|
108,560
|
0.7%
|
33.4%
|
313,405
|
402,380
|
28.4%
|
|
Provision
for credit losses on
loan portfolio, net of
recoveries
|
(1,079,129)
|
(827,526)
|
(677,649)
|
-18.1%
|
-37.2%
|
(3,455,324)
|
(3,280,952)
|
-5.0%
|
|
Net
interest, similar income
and expenses, after
provision for credit
losses on loan portfolio
|
2,033,060
|
2,495,854
|
2,679,258
|
7.3%
|
31.8%
|
8,529,876
|
9,778,702
|
14.6%
|
|
Other
income
|
||||||||
|
Fee
income
|
773,261
|
898,766
|
912,573
|
1.5%
|
18.0%
|
3,039,965
|
3,442,417
|
13.2%
|
|
Net
gain on foreign exchange
transactions
|
268,615
|
299,425
|
313,538
|
4.7%
|
16.7%
|
997,648
|
1,166,567
|
16.9%
|
|
Net
gain (loss) on
securities
|
10,759
|
24,114
|
(19,571)
|
n.a.
|
n.a.
|
(23,102)
|
27,933
|
n.a.
|
|
Net
gain on derivatives held
for trading
|
21,750
|
13,639
|
24,881
|
82.4%
|
14.4%
|
99,156
|
77,674
|
-21.7%
|
|
Net
loss (gain) from
exchange differences
|
8,795
|
(10,714)
|
(1,989)
|
-81.4%
|
n.a.
|
9,431
|
(5,455)
|
n.a.
|
|
Others
|
101,244
|
19,336
|
95,118
|
391.9%
|
-6.1%
|
345,103
|
246,098
|
-28.7%
|
|
Total
other income
|
1,184,424
|
1,244,566
|
1,324,550
|
6.4%
|
11.8%
|
4,468,201
|
4,955,234
|
10.9%
|
|
Total
expenses
|
||||||||
|
Salaries
and employee benefits
|
(788,885)
|
(850,918)
|
(973,566)
|
14.4%
|
23.4%
|
(3,071,184)
|
(3,441,259)
|
12.0%
|
|
Administrative
expenses
|
(874,101)
|
(802,127)
|
(978,885)
|
22.0%
|
12.0%
|
(2,954,789)
|
(3,260,696)
|
10.4%
|
|
Depreciation
and amortization (2)
|
(146,657)
|
(146,719)
|
(154,731)
|
5.5%
|
5.5%
|
(547,006)
|
(583,990)
|
6.8%
|
|
Other
expenses
|
(124,472)
|
(62,292)
|
(104,374)
|
67.6%
|
-16.1%
|
(296,430)
|
(283,169)
|
-4.5%
|
|
Total
expenses
|
(1,934,115)
|
(1,862,056)
|
(2,211,556)
|
18.8%
|
14.3%
|
(6,869,409)
|
(7,569,114)
|
10.2%
|
|
Profit
before income tax
|
1,283,369
|
1,878,364
|
1,792,252
|
-4.6%
|
39.7%
|
6,128,668
|
7,164,822
|
16.9%
|
|
Income
tax
|
(327,708)
|
(472,791)
|
(517,677)
|
9.5%
|
58.0%
|
(1,545,006)
|
(1,853,018)
|
19.9%
|
|
Net
profit
|
955,661
|
1,405,573
|
1,274,575
|
-9.3%
|
33.4%
|
4,583,662
|
5,311,804
|
15.9%
|
|
Non-controlling
interest
|
(2,670)
|
(3,172)
|
(5,867)
|
85.0%
|
119.7%
|
(10,081)
|
(15,418)
|
52.9%
|
|
Net
profit attributable to
BCP Consolidated
|
952,991
|
1,402,401
|
1,268,708
|
-9.5%
|
33.1%
|
4,573,581
|
5,296,386
|
15.8%
|
|
Quarter
|
As
of
|
||||
|
4Q23
|
3Q24
|
4Q24
|
Dec
23
|
Dec
24
|
|
|
Profitability
|
|||||
|
ROAA
(1)(2)
|
2.0%
|
2.8%
|
2.4%
|
2.4%
|
2.6%
|
|
ROAE
(1)(2)
|
15.5%
|
22.9%
|
19.8%
|
19.0%
|
20.8%
|
|
Net
interest margin (1)(2)
|
6.67%
|
6.84%
|
6.70%
|
6.41%
|
6.69%
|
|
Risk-adjusted
Net interest margin (1)(2)
|
4.36%
|
5.13%
|
5.35%
|
4.56%
|
5.01%
|
|
Funding
cost (1)(2)(3)
|
2.82%
|
2.43%
|
2.29%
|
2.74%
|
2.51%
|
|
Quality
of loan portfolio
|
|||||
|
Internal
overdue ratio
|
4.4%
|
4.4%
|
3.8%
|
4.4%
|
3.8%
|
|
NPL
ratio
|
6.2%
|
6.1%
|
5.5%
|
6.2%
|
5.5%
|
|
Coverage
ratio of IOLs
|
133.6%
|
136.2%
|
147.0%
|
133.6%
|
147.0%
|
|
Coverage
ratio of NPLs
|
95.3%
|
97.4%
|
103.2%
|
95.3%
|
103.2%
|
|
Cost
of risk (4)
|
3.3%
|
2.5%
|
2.1%
|
2.6%
|
2.5%
|
|
Operating
efficiency
|
|||||
|
Operating
expenses / Total income
(5)
|
43.2%
|
39.8%
|
45.7%
|
40.7%
|
41.1%
|
|
Operating
expenses / Total average
assets (1)(2)(5)
|
3.7%
|
3.5%
|
4.1%
|
3.4%
|
3.6%
|
|
| |
Earnings
Release 4Q / 2024
|
Analysis of
4Q24 Consolidated
Results
|
|
12.
Appendix
|
(S/ Thousands, IFRS)
|
As of
|
% change
|
||||
|
Dec
23
|
Sep
24
|
Dec
24
|
QoQ | YoY | |
|
ASSETS
|
|||||
|
Cash
and due from banks
|
|||||
|
Non-interest
bearing
|
5,236,016
|
4,561,696
|
4,792,810
|
5.1%
|
-8.5%
|
|
Interest
bearing
|
24,554,369
|
35,307,925
|
38,063,318
|
7.8%
|
55.0%
|
|
Total
cash and due from
banks
|
29,790,385
|
39,869,621
|
42,856,128
|
7.5%
|
43.9%
|
|
Cash
collateral, reverse
repurchase agreements
and securities
borrowing
|
100,211
|
622,399
|
19,151
|
-96.9%
|
-80.9%
|
|
Fair
value through profit
or loss investments
|
362,360
|
704,968
|
603,635
|
-14.4%
|
66.6%
|
|
Fair
value through other
comprehensive income
investments
|
18,178,514
|
19,855,738
|
20,521,337
|
3.4%
|
12.9%
|
|
Amortized
cost investments
|
9,415,232
|
8,116,588
|
8,214,476
|
1.2%
|
-12.8%
|
|
Loans
|
119,425,134
|
117,687,023
|
120,571,109
|
2.5%
|
1.0%
|
|
Current
|
114,445,408
|
112,874,488
|
116,314,563
|
3.0%
|
1.6%
|
|
Internal
overdue loans
|
4,979,726
|
4,812,535
|
4,256,546
|
-11.6%
|
-14.5%
|
|
Less
-
allowance for loan
losses
|
(6,764,601)
|
(6,768,497)
|
(6,513,398)
|
-3.8%
|
-3.7%
|
|
Loans,
net
|
112,660,533
|
110,918,526
|
114,057,711
|
2.8%
|
1.2%
|
|
Property,
furniture and
equipment, net (1)
|
1,300,690
|
1,246,350
|
1,271,219
|
2.0%
|
-2.3%
|
|
Due
from customers on
acceptances
|
412,401
|
466,957
|
528,184
|
13.1%
|
28.1%
|
|
Investments
in associates
|
2,917,670
|
2,682,807
|
2,612,080
|
-2.6%
|
-10.5%
|
|
Other
assets (2)
|
5,776,165
|
7,227,029
|
6,897,204
|
-4.6%
|
19.4%
|
|
Total
Assets
|
180,914,161
|
191,710,983
|
197,581,125
|
3.1%
|
9.2%
|
|
Liabilities
and Equity
|
|||||
|
Deposits
and obligations
|
|||||
|
Non-interest
bearing (1)
|
39,385,047
|
45,296,819
|
44,267,223
|
-2.3%
|
12.4%
|
|
Interest
bearing (1)
|
83,047,645
|
85,282,102
|
92,516,659
|
8.5%
|
11.4%
|
|
Total
deposits and
obligations
|
122,432,692
|
130,578,921
|
136,783,882
|
4.8%
|
11.7%
|
|
Payables
from repurchase
agreements and
securities lending
|
7,583,520
|
5,122,666
|
6,711,406
|
31.0%
|
-11.5%
|
|
BCRP
instruments
|
7,039,350
|
4,289,860
|
6,154,351
|
43.5%
|
-12.6%
|
|
Repurchase
agreements with third
parties
|
544,170
|
832,806
|
557,055
|
-33.1%
|
2.4%
|
|
Due
to banks and
correspondents
|
10,497,414
|
11,160,491
|
8,962,379
|
-19.7%
|
-14.6%
|
|
Bonds
and notes issued
|
10,350,260
|
13,045,879
|
13,317,657
|
2.1%
|
28.7%
|
|
Due
from customers on
acceptances
|
412,401
|
466,957
|
528,184
|
13.1%
|
28.1%
|
|
Financial
liabilities at fair
value through profit
or loss
|
91,966
|
354,562
|
-
|
n.a.
|
n.a. |
|
Other
liabilities (3)
|
4,544,335
|
5,629,964
|
5,265,739
|
-6.5%
|
15.9%
|
|
Total
Liabilities
|
155,912,588
|
166,359,440
|
171,569,247
|
3.1%
|
10.0%
|
|
Net
equity
|
25,001,573
|
25,351,543
|
26,011,878
|
2.6%
|
4.0%
|
|
Capital
stock
|
12,679,794
|
12,679,794
|
12,679,794
|
0.0%
|
0.0%
|
|
Reserves
|
6,372,059
|
6,372,468
|
5,905,440
|
-7.3%
|
-7.3%
|
|
Unrealized
gains and losses
|
(109,202)
|
222,730
|
81,399
|
-63.5%
|
n.a.
|
|
Retained
earnings
|
6,058,922
|
6,076,551
|
7,345,245
|
20.9%
|
21.2%
|
|
Total
Net Equity
|
25,001,573
|
25,351,543
|
26,011,878
|
2.6%
|
4.0%
|
|
Total
liabilities and equity
|
180,914,161
|
191,710,983
|
197,581,125
|
3.1%
|
9.2%
|
|
Off-balance
sheet
|
134,844,989
|
140,242,082
|
135,041,209
|
-3.7%
|
0.1%
|
|
Total
performance bonds,
stand-by and L/Cs.
|
19,328,506
|
19,593,247
|
21,683,478
|
10.7%
|
12.2%
|
|
Undrawn
credit lines, advised
but not committed
|
74,091,027
|
75,257,883
|
71,516,643
|
-5.0%
|
-3.5%
|
|
Total
derivatives (notional)
and others
|
41,425,456
|
45,390,952
|
41,841,088
|
-7.8%
|
1.0%
|
| (1) |
Right
of use asset of lease
contracts is included
by application of IFRS
16.
|
| (2) |
Mainly
includes intangible
assets, other
receivable accounts,
trading derivatives
receivable accounts
and tax credit
|
| (3) |
Mainly
includes other payable
accounts, trading
derivatives payable
accounts and taxes for
payable.
|
|
| |
Earnings
Release 4Q / 2024
|
Analysis
of 4Q24
Consolidated
Results
|
|
12.
Appendix
|
|
Quarter
|
% change
|
As of
|
%
change
|
|||||
|
4Q23
|
3Q24 |
4Q24
|
QoQ | YoY | Dec 23 | Dec 24 | Dec 24 / Dec 23 | |
|
Interest
income and expense
|
||||||||
|
Interest
and similar income
|
3,507,996
|
3,616,878
|
3,639,485
|
0.6%
|
3.7%
|
13,486,861
|
14,345,027
|
6.4%
|
|
Interest
and similar expenses (1)
|
(936,600)
|
(856,286)
|
(857,707)
|
0.2%
|
-8.4%
|
(3,668,766)
|
(3,529,865)
|
-3.8%
|
|
Interest
income and expense
|
2,571,396
|
2,760,592
|
2,781,778
|
0.8%
|
8.2%
|
9,818,095
|
10,815,162
|
10.2%
|
|
Provision
for credit losses on
loan portfolio
|
(922,169)
|
(714,464)
|
(616,654)
|
-13.7%
|
-33.1%
|
(2,845,501)
|
(2,832,738)
|
-0.4%
|
|
Recoveries
of written-off loans
|
52,943
|
79,057
|
80,396
|
1.7%
|
51.9%
|
213,583
|
279,687
|
31.0%
|
|
Provision
for credit losses on
loan portfolio, net of
recoveries
|
(869,226)
|
(635,407)
|
(536,258)
|
-15.6%
|
-38.3%
|
(2,631,918)
|
(2,553,051)
|
-3.0%
|
|
Net
interest, similar
income and expenses,
after provision for
credit losses on loan
portfolio
|
1,702,170
|
2,125,185
|
2,245,520
|
5.7%
|
31.9%
|
7,186,177
|
8,262,111
|
15.0%
|
|
Other
income
|
||||||||
|
Fee
income
|
748,269
|
879,996
|
888,292
|
0.9%
|
18.7%
|
2,927,395
|
3,352,254
|
14.5%
|
|
Net
gain on foreign
exchange transactions
|
266,027
|
297,478
|
311,657
|
4.8%
|
17.2%
|
988,264
|
1,157,575
|
17.1%
|
|
Net
gain on securities
|
63,754
|
73,084
|
88,641
|
21.3%
|
39.0%
|
181,511
|
305,786
|
68.5%
|
|
Net
gain (loss) from
associates
|
(1,373)
|
3,078
|
88
|
-97.1%
|
n.a.
|
(9,180)
|
5,278
|
n.a.
|
|
Net
gain on derivatives
held for trading
|
29,594
|
13,899
|
23,551
|
69.4%
|
-20.4%
|
89,706
|
73,326
|
-18.3%
|
|
Net
loss (gain) from
exchange differences
|
(13)
|
(10,324)
|
(1,525)
|
-85.2%
|
n.a.
|
18,226
|
3,248
|
-82.2%
|
|
Others
|
59,169
|
18,406
|
94,340
|
412.6%
|
59.4%
|
292,352
|
229,387
|
-21.5%
|
|
Total
other income
|
1,165,427
|
1,275,617
|
1,405,044
|
10.1%
|
20.6%
|
4,511,231
|
5,126,854
|
14.2%
|
|
Total
expenses
|
||||||||
|
Salaries
and employee benefits
|
(592,595)
|
(640,392)
|
(762,850)
|
19.1%
|
28.7%
|
(2,254,885)
|
(2,615,512)
|
16.0%
|
|
Administrative
expenses
|
(794,793)
|
(720,329)
|
(899,798)
|
24.9%
|
13.2%
|
(2,656,468)
|
(2,950,178)
|
11.1%
|
|
Depreciation
and amortization (2)
|
(123,363)
|
(123,740)
|
(131,376)
|
6.2%
|
6.5%
|
(460,043)
|
(491,360)
|
6.8%
|
|
Other
expenses
|
(100,066)
|
(57,047)
|
(106,338)
|
86.4%
|
6.3%
|
(252,114)
|
(266,982)
|
5.9%
|
|
Total
expenses
|
(1,610,817)
|
(1,541,508)
|
(1,900,362)
|
23.3%
|
19.3%
|
(5,623,510)
|
(6,324,032)
|
12.5%
|
|
Profit
before income tax
|
1,274,977
|
1,859,294
|
1,750,202
|
-5.9%
|
37.3%
|
6,073,898
|
7,064,933
|
16.3%
|
|
Income
tax
|
(320,936)
|
(456,956)
|
(481,509)
|
5.4%
|
50.0%
|
(1,497,896)
|
(1,767,305)
|
18.0%
|
|
Net
profit
|
954,041
|
1,402,338
|
1,268,693
|
-9.5%
|
33.0%
|
4,576,002
|
5,297,628
|
15.8%
|
|
Non-controlling
interest
|
-
|
-
|
-
|
n.a. n.a.
|
-
|
-
|
n.a.
|
|
|
Net
profit attributable to
BCP
|
954,041
|
1,402,338
|
1,268,693
|
-9.5%
|
33.0%
|
4,576,002
|
5,297,628
|
15.8%
|
| (1) |
Financing
expenses related to
lease agreements are
included according to
the application of
IFRS 16.
|
| (2) |
The
effect of the
application of IFRS 16
is included, which
corresponds to a
greater depreciation
for the asset for
right-of-use".
|
|
Quarter
|
As
of |
|||||
|
4Q23
|
3Q24
|
4Q24
|
Dec
23
|
|
Dec
24
|
|
|
Profitability
|
||||||
|
ROAA
(1)(2)
ROAE
(1)(2)
|
2.1%
15.5%
|
2.9%
22.9%
|
2.6%
19.8%
|
2.5%
19.0%
|
2.8%
20.8%
|
|
|
Net
interest margin (1)(2)
|
6.0%
|
6.2%
|
6.0%
|
5.7%
|
6.0%
|
|
|
Risk-adjusted
Net interest margin (1)(2)
|
4.0%
|
4.7%
|
4.9%
|
4.2%
|
4.6%
|
|
|
Funding
cost (1)(2)(3)
|
2.5%
|
2.2%
|
2.1%
|
2.4%
|
2.2%
|
|
|
Quality
of loan portfolio
|
||||||
|
Internal
overdue ratio
|
4.2%
|
4.1%
|
3.5%
|
4.2%
|
3.5%
|
|
|
NPL
ratio
|
6.0%
|
5.9%
|
5.2%
|
6.0%
|
5.2%
|
|
|
Coverager
rattio of IOLs
|
135.8%
|
140.6%
|
153.0%
|
135.8%
|
153.0%
|
|
|
Coverage
ratio of NPLs
|
93.8%
|
97.2%
|
103.5%
|
93.8%
|
103.5%
|
|
|
Cost
of risk (4)
|
2.9%
|
2.1%
|
1.8%
|
2.2%
|
2.1%
|
|
|
Operating
efficiency
|
||||||
|
Operating
expenses / Total
income (5)
|
41.8%
|
37.6%
|
44.8%
|
38.8%
|
39.3%
|
|
|
Operating
expenses / Total
average assets (1)(2)(5)
|
3.3%
|
3.1%
|
3.7%
|
3.0%
|
3.2%
|
|
| (1) |
Ratios
are annualized.
|
| (2) |
Averages
are determined as the
average of
period-beginning and
period-ending
balances.
|
| (3) | The funding costs differs from previously reported due to a methodology change in the denominator, which no longer includes the following accounts: acceptances outstanding, reserves for property and casualty claims, reserve for unearned premiums, reinsurance payable and other liabilities. |
| (4) |
Cost
of risk: Annualized
provision for loan
losses / Average total
loans.
|
| (5) | Total income includes net interest income, fee income, net gain on foreign exchange transactions, result on exchange difference and net gain on derivatives. Operating expenses includes Salaries and social benefits, administrative, general and tax expenses and depreciation and amortization. |
|
| |
Earnings
Release 4Q / 2024
|
Analysis
of 4Q24
Consolidated
Results
|
|
12.
Appendix
|
|
As
of
|
% change | ||||
|
Dec
23
|
Sep
24
|
Dec
24
|
QoQ
|
YoY | |
|
ASSETS
|
|||||
|
Cash
and due from banks
|
2,552,099
|
2,215,684
|
2,216,270
|
0.0%
|
-13.2%
|
|
Investments
|
1,522,673
|
1,405,967
|
1,739,760
|
23.7%
|
14.3%
|
|
Loans
|
9,401,800
|
9,829,567
|
9,938,971
|
1.1%
|
5.7%
|
|
Current
|
9,112,232
|
9,504,083
|
9,609,399
|
1.1%
|
5.5%
|
|
Internal
overdue loans
|
240,528
|
270,433
|
266,296
|
-1.5%
|
10.7%
|
|
Refinanced
loans
|
49,040
|
55,051
|
63,276
|
14.9%
|
29.0%
|
|
Less
-
allowance for loan
losses
|
(351,688)
|
(357,720)
|
(366,704)
|
2.5%
|
4.3%
|
|
Loans,
net
|
9,050,112
|
9,471,846
|
9,572,267
|
1.1%
|
5.8%
|
|
Property,
furniture and
equipment, net
|
66,129
|
130,797
|
132,210
|
1.1%
|
99.9%
|
|
Other
assets
|
309,864
|
264,972
|
314,226
|
18.6%
|
1.4%
|
|
Total
assets
|
13,500,877
|
13,489,266
|
13,974,733
|
3.6%
|
3.5%
|
|
LIABILITIES
AND NET
SHAREHOLDERS' EQUITY
|
|||||
|
Deposits
and obligations
|
11,482,143
|
11,704,551
|
12,145,811
|
3.8%
|
5.8%
|
|
Due
to banks and
correspondents
|
78,296
|
2,032
|
-
|
-100.0%
|
-100.0%
|
|
Bonds
and subordinated
debt
|
161,916
|
162,042
|
157,253
|
-3.0%
|
-2.9%
|
|
Other
liabilities
|
889,949
|
651,779
|
665,519
|
2.1%
|
-25.2%
|
|
Total
liabilities
|
12,612,304
|
12,520,404
|
12,968,583
|
3.6%
|
2.8%
|
|
Net
equity
|
888,573
|
968,862
|
1,006,150
|
3.8%
|
13.2%
|
|
TOTAL
LIABILITIES AND NET
EQUITY
|
13,500,877
|
13,489,266
|
13,974,733
|
3.6%
|
3.5%
|
| Quarter |
% change
|
Up to
|
% change
|
|||||
|
4Q23
|
3Q24
|
4Q24
|
QoQ
|
YoY |
Dec 23
|
Dec 24
|
Dec 24 /Dec
23
|
|
|
Interests
income, net
|
84,160
|
87,687
|
87,812
|
0.1%
|
4.3%
|
332,337
|
353,396
|
6.3%
|
|
Provisions
for doubtful
accounts
receivable, net of
recoveries
|
(27,530)
|
(10,542)
|
(25,027)
|
137.4%
|
-9.1%
|
(38,040)
|
(73,688)
|
93.7%
|
|
Net
interest income
after provisions
|
56,630
|
77,145
|
62,785
|
-18.6%
|
10.9%
|
294,297
|
279,708
|
-5.0%
|
|
Non
financial income
|
48,427
|
36,365
|
85,923
|
136.3%
|
77.4%
|
210,717
|
276,802
|
31.4%
|
|
Total
expenses
|
(82,730)
|
(77,107)
|
(114,966)
|
49.1%
|
39.0%
|
(359,811)
|
(391,844)
|
8.9%
|
|
Translation
result
|
190
|
850
|
1,281
|
50.7%
|
574.2%
|
50
|
1,731
|
3362.0%
|
|
Income
tax
|
(2,865)
|
(20,638)
|
(11,521)
|
-44.2%
|
302.1%
|
(62,202)
|
(72,886)
|
17.2%
|
|
Net profit
|
19,652
|
16,615
|
23,502
|
41.5%
|
19.6%
|
83,051
|
93,511
|
12.6%
|
|
Quarter
|
% change |
Up to
|
% change
|
||||||
|
4Q23
|
3Q24
|
4Q24
|
QoQ
|
YoY |
Dec 23
|
|
Dec
24
|
Dec
24 /Dec 23
|
|
|
Efficiency
ratio
|
59.0%
|
80.3%
|
63.0%
|
-1732
pbs
|
397
pbs
|
61.3%
|
63.9%
|
262
pbs
|
|
|
ROAE
|
8.8%
|
6.8%
|
9.5%
|
271
pbs
|
68
pbs
|
9.5%
|
9.9%
|
37
pbs
|
|
|
L/D
ratio
|
81.9%
|
84.0%
|
81.8%
|
-215
pbs
|
-5
pbs
|
||||
|
IOL
ratio
|
2.6%
|
2.8%
|
2.7%
|
-7
pbs
|
12
pbs
|
||||
|
NPL
ratio
|
3.1%
|
3.3%
|
3.3%
|
1 pbs
|
24
pbs
|
||||
|
Coverage
of IOLs
|
146.2%
|
132.3%
|
137.7%
|
543
pbs
|
-851
pbs
|
||||
|
Coverage
of NPLs
|
121.5%
|
109.9%
|
111.3%
|
136
pbs
|
-1019
pbs
|
||||
|
Branches
|
46
|
46
|
46
|
0.0%
|
0.0%
|
||||
|
Agentes
|
1,350
|
1,541
|
1,834
|
19.0%
|
35.9%
|
||||
|
ATMs
|
315
|
314
|
314
|
0.0%
|
-0.3%
|
||||
|
Employees
|
1,726
|
1,791
|
1,819
|
1.6%
|
5.4%
|
||||
|
| |
Earnings
Release 4Q / 2024
|
Analysis
of 4Q24
Consolidated
Results
|
|
12.
Appendix
|
|
As
of
|
% change | ||||
|
Dec
23
|
Sep
24
|
Dec
24
|
QoQ
|
YoY | |
|
ASSETS
|
|||||
|
Cash
and due from banks
|
1,121,452
|
1,590,356
|
1,833,225
|
15.3%
|
63.5%
|
|
Investments
|
2,556,436
|
3,094,635
|
2,917,396
|
-5.7%
|
14.1%
|
|
Total
loans
|
13,269,018
|
12,118,953
|
12,239,171
|
1.0%
|
-7.8%
|
|
Current
|
12,333,980
|
11,168,560
|
11,330,124
|
1.4%
|
-8.1%
|
|
Internal
overdue loans
|
834,356
|
846,455
|
802,133
|
-5.2%
|
-3.9%
|
|
Refinanced
|
100,682
|
103,938
|
106,914
|
2.9%
|
6.2%
|
|
Allowance
for loan losses
|
(1,002,847)
|
(940,310)
|
(924,703)
|
-1.7%
|
-7.8%
|
|
Net
loans
|
12,266,171
|
11,178,643
|
11,314,468
|
1.2%
|
-7.8%
|
|
Property,
plant and equipment,
net
|
139,064
|
132,430
|
131,261
|
-0.9%
|
-5.6%
|
|
Other
assets
|
815,263
|
795,856
|
750,972
|
-5.6%
|
-7.9%
|
|
Total
assets
|
16,898,386
|
16,791,920
|
16,947,322
|
0.9%
|
0.3%
|
|
LIABILITIES
AND NET
SHAREHOLDERS' EQUITY
|
|||||
|
Deposits
and obligations
|
9,999,230
|
10,800,163
|
11,060,598
|
2.4%
|
10.6%
|
|
Due
to banks and
correspondents
|
2,411,642
|
1,958,657
|
1,985,746
|
1.4%
|
-17.7%
|
|
Bonds
and subordinated
debt
|
611,166
|
306,113
|
309,551
|
1.1%
|
-49.4%
|
|
Other
liabilities
|
879,725
|
983,614
|
923,059
|
-6.2%
|
4.9%
|
|
Total
liabilities
|
13,901,763
|
14,048,547
|
14,278,954
|
1.6%
|
2.7%
|
|
Net
equity
|
2,996,623
|
2,743,373
|
2,668,368
|
-2.7%
|
-11.0%
|
|
TOTAL
LIABILITIES AND NET
SHAREHOLDERS' EQUITY
|
16,898,386
|
16,791,920
|
16,947,322
|
0.9%
|
0.3%
|
|
Quarter
|
%
change
|
Up to |
%
change
|
|||||
|
4Q23
|
3Q24
|
4Q24
|
QoQ
|
YoY |
Dec 23
|
Dec 24 |
Dec
24 / Dec 23
|
|
|
Net
interest income
|
538,522
|
562,421
|
574,720
|
2.2%
|
6.7%
|
2,160,467
|
2,240,270
|
3.7%
|
|
Provision
for loan losses, net
of recoveries
|
(208,880)
|
(192,435)
|
(141,899)
|
-26.3%
|
-32.1%
|
(822,663)
|
(727,833)
|
-11.5%
|
|
Net
interest income
after provisions
|
329,642
|
369,986
|
432,821
|
17.0%
|
31.3%
|
1,337,804
|
1,512,437
|
13.1%
|
|
Non-financial
income
|
56,230
|
30,861
|
32,748
|
6.1%
|
-41.8%
|
165,258
|
130,695
|
-20.9%
|
|
Total
expenses
|
(324,854)
|
(320,796)
|
(312,016)
|
-2.7%
|
-4.0%
|
(1,248,582)
|
(1,246,390)
|
-0.2%
|
|
Translation
result
|
(454)
|
(337)
|
(466)
|
38.3%
|
2.6%
|
(3,813)
|
(1,860)
|
-51.2%
|
|
Income
taxes
|
(6,670)
|
(15,890)
|
(36,098)
|
127.2%
|
441.2%
|
(46,892)
|
(85,782)
|
82.9%
|
|
Net
income
|
53,894
|
63,824
|
116,989
|
83.3%
|
117.1%
|
203,775
|
309,100
|
51.7%
|
|
Quarter
|
%
change
|
%
change
|
|||||||
|
4Q23
|
3Q24
|
4Q24
|
QoQ
|
YoY |
Dec
23
|
Up
to
|
Dec
24
|
Dec
24 / Dec 23
|
|
|
Efficiency
ratio
|
52.9%
|
54.2%
|
52.2%
|
-197
bps
|
-67
bps
|
52.7%
|
52.7%
|
0
bps
|
|
|
ROAE
|
7.3%
|
9.4%
|
17.3%
|
787
bps
|
1002
bps
|
7.1%
|
10.9%
|
386
bps
|
|
|
ROAE
incl. Goowdill
|
6.9%
|
9.0%
|
16.4%
|
748
bps
|
949
bps
|
6.7%
|
10.4%
|
367
bps
|
|
|
L/D
ratio
|
132.7%
|
112.2%
|
110.7%
|
-156
bps
|
-2204
bps
|
||||
|
IOL
ratio
|
6.3%
|
7.0%
|
6.6%
|
-43
bps
|
27
bps
|
||||
|
NPL
ratio
|
7.0%
|
7.8%
|
7.4%
|
-42
bps
|
38
bps
|
||||
|
Coverage
of IOLs
|
120.2%
|
111.1%
|
115.3%
|
419
bps
|
-491
bps
|
||||
|
Coverage
of NPLs
|
107.3%
|
98.9%
|
101.7%
|
278
bps
|
-553
bps
|
||||
|
Branches
(1)
|
292
|
283
|
283
|
-
|
(9) | ||||
|
Employees
|
9,842
|
10,101
|
9,950
|
(151)
|
108 | ||||
| (1) |
Includes
Banco de la Nacion
branches, which in
December 23 were 36,
in September 24 were
36 and in December 24
were 36.
|
|
| |
Earnings
Release 4Q / 2024
|
Analysis
of 4Q24
Consolidated
Results
|
|
12.
Appendix
|
|
As
of
|
%
change
|
||||
|
Dec
23
|
Sep
24
|
Dec
24
|
QoQ
|
YoY
|
|
|
Cash
and due from banks
|
109,574
|
144,402
|
123,278
|
-14.6%
|
12.5%
|
|
Non-interest
bearing
|
6,176
|
4,555
|
3,779
|
-17.0%
|
-38.8%
|
|
Interest
bearing
|
103,398
|
139,847
|
119,499
|
-14.6%
|
15.6%
|
|
Fair
value through profit
or loss investments
|
333,577
|
317,682
|
306,759
|
-3.4%
|
-8.0%
|
|
Fair
value through other
comprehensive income
investments
|
687
|
1,171
|
1,218
|
4.0%
|
77.3%
|
|
Property,
plant and equipment,
net
|
9,700
|
7,638
|
7,347
|
-3.8%
|
-24.3%
|
|
Other
Assets
|
287,191
|
260,067
|
219,369
|
-15.6%
|
-23.6%
|
|
Total
Assets
|
740,729
|
730,960
|
657,971
|
-10.0%
|
-11.2%
|
|
Due
to banks and
correspondents
|
7
|
6
|
22
|
266.7%
|
214.3%
|
|
Lease
payable
|
6,254
|
4,203
|
3,723
|
-11.4%
|
-40.5%
|
|
Other
liabilities
|
234,396
|
212,464
|
178,674
|
-15.9%
|
-23.8%
|
|
Total
Liabilities
|
240,657
|
216,673
|
182,419
|
-15.8%
|
-24.2%
|
|
Capital
stock
|
40,505
|
40,505
|
40,505
|
0.0%
|
0.0%
|
|
Reserves
|
20,243
|
20,243
|
20,243
|
0.0%
|
0.0%
|
|
Other
reserves
|
178
|
425
|
459
|
8.0%
|
157.9%
|
|
Retained
earnings
|
289,597
|
344,510
|
281,419
|
-18.3%
|
-2.8%
|
|
Net
Income for the
Period
|
149,549
|
108,604
|
132,926
|
22.4%
|
-11.1%
|
|
Total
Liabilities and
Equity
|
740,729
|
730,960
|
657,971
|
-10.0%
|
-11.2%
|
|
Quarter
|
% change
|
Up to
|
% change
|
|||||
|
4Q23
|
3Q24
|
4Q24
|
QoQ
|
YoY
|
Dec 23
|
Dec 24
|
Dec 24 / Dec 23
|
|
|
Financial
income
|
1,768
|
1,429
|
1,786
|
25.0%
|
1.0%
|
6,902
|
5,678
|
-17.7%
|
|
Financial
expenses
|
(1,277)
|
(1,055)
|
(1,782)
|
68.9%
|
39.5%
|
(3,212)
|
(4,083)
|
27.1%
|
|
Interest income, net
|
491
|
374
|
4
|
-98.9%
|
-99.2%
|
3,690
|
1,595
|
-56.8%
|
|
Fee income
|
87,458
|
90,748
|
88,102
|
-2.9%
|
0.7%
|
350,846
|
372,480
|
6.2%
|
|
Net gain
(loss) on securities
|
14,673
|
2,579
|
(2,115)
|
-182.0%
|
-114.4%
|
32,772
|
10,528
|
-67.9%
|
|
Net gain
(loss) from exchange
differences
|
(466)
|
110
|
(32)
|
-129.1%
|
-93.1%
|
(793)
|
(530)
|
-33.2%
|
|
Other
income
|
760
|
124
|
5,628
|
4438.7%
|
640.5%
|
5,523
|
7,137
|
29.2%
|
|
Salaries
and employee benefits
|
(24,498)
|
(22,384)
|
(29,371)
|
31.2%
|
19.9%
|
(85,874)
|
(97,457)
|
13.5%
|
|
Administrative
expenses
|
(16,550)
|
(17,272)
|
(20,545)
|
18.9%
|
24.1%
|
(70,196)
|
(78,570)
|
11.9%
|
|
Depreciation
and amortization
|
(6,388)
|
(6,603)
|
(6,612)
|
0.1%
|
3.5%
|
(25,273)
|
(26,381)
|
4.4%
|
|
Other
expenses
|
(53)
|
(245)
|
(71)
|
-71.0%
|
34.0%
|
(4,388)
|
(1,249)
|
-71.5%
|
|
Profit before income
tax
|
55,427
|
47,431
|
34,988
|
-26.2%
|
-36.9%
|
206,307
|
#####
|
-9.1%
|
|
Income tax
|
(15,047)
|
(12,744)
|
(10,666)
|
-16.3%
|
-29.1%
|
(56,758)
|
(54,627)
|
-3.8%
|
|
Net profit
|
40,380
|
34,687
|
24,322
|
-29.9%
|
-39.8%
|
149,549
|
#####
|
-11.1%
|
|
Quarter
|
Change
|
Up
to
|
Change
|
|||||
|
4Q23
|
3Q24
|
4Q24
|
QoQ
|
YoY
|
Dec
23
|
Dec
24
|
Dec
24 / Dec 23
|
|
|
ROE
|
33.7%
|
27.9%
|
19.7%
|
-827 bps
|
-1401 bps
|
30.0%
|
27.2%
|
-276 bps
|
|
Net Interest Margin
|
0.5%
|
0.3%
|
0.0%
|
-34 bps
|
-47 bps
|
0.9%
|
0.4%
|
-50 bps
|
|
Efficiency Ratio
|
54.2%
|
50.7%
|
64.2%
|
1348 bps
|
996 bps
|
51.3%
|
54.2%
|
292 bps
|
|
Operating Expenses /
Total Average Assets
|
26.6%
|
26.5%
|
32.6%
|
609 bps
|
594 bps
|
24.6%
|
28.9%
|
437 bps
|
|
Prima
|
System
|
Share
%
|
Prima
|
System
|
Share
%
|
|
|
3Q24
|
3Q24
|
3Q24
|
4Q24
|
4Q24
|
4Q24
|
|
|
AUMs
(S/ Millions)
|
32,142
|
106,729
|
30%
|
32,118
|
106,976
|
30%
|
|
Affiliates
(S/ Millions)
|
2,341,483
|
9,677,410
|
24%
|
2,340,087
|
9,795,699
|
24%
|
|
Collections
(S/ Millions)
|
1,044
|
4,003
|
26%
|
711
|
2,704
|
26%
|
|
| |
Earnings
Release 4Q / 2024
|
Analysis
of 4Q24 Consolidated
Results
|
|
12. Appendix
|
|
As of
|
% Change
|
||||
|
Dec 23
|
Sep 24
|
Dec 24
|
QoQ
|
YoY
|
|
|
Total Assets
|
16,549,171
|
17,683,826
|
17,890,138
|
1.2%
|
8.1%
|
|
Investment
on Securities (1)
|
12,704,842
|
13,550,847
|
13,898,637
|
2.6%
|
9.4%
|
|
Total
Liabilities
|
13,443,688
|
14,442,027
|
14,504,765
|
0.4%
|
7.9%
|
|
Net Equity
|
3,086,571
|
3,226,717
|
3,369,625
|
4.4%
|
9.2%
|
|
Quarter
|
%
Change
|
As
of
|
%
change
|
|||||
|
4Q23
|
3Q24
|
4Q24
|
QoQ
|
YoY
|
Dec
23
|
Dec
24
|
Dec
24 / Dec 23
|
|
|
Insurance Service
Result
|
255,887
|
308,072
|
293,055
|
-4.9%
|
14.5%
|
1,152,472
|
1,229,908
|
6.7%
|
|
Reinsurance Result
|
(96,996)
|
(151,920)
|
(102,995)
|
-32.2%
|
6.2%
|
(426,290)
|
(530,204)
|
24.4%
|
|
Insurance
underwriting result
|
158,891
|
156,152
|
190,060
|
21.7%
|
19.6%
|
726,182
|
699,704
|
-3.6%
|
|
Interest income
|
183,933
|
209,425
|
208,159
|
-0.6%
|
13.2%
|
778,280
|
834,304
|
7.2%
|
|
Interest
Expenses
|
(126,386)
|
(135,554)
|
(138,943)
|
2.5%
|
9.9%
|
(493,247)
|
(535,059)
|
8.5%
|
|
Net
Interest Income
|
57,547
|
73,871
|
69,216
|
-6.3%
|
20.3%
|
285,033
|
299,245
|
5.0%
|
|
Fee Income and Gain
in FX
|
(2,743)
|
(4,676)
|
(4,066)
|
-13.0%
|
48.2%
|
(11,951)
|
(14,265)
|
19.4%
|
|
Other
Income No Core:
|
||||||||
|
Net gain (loss) from
exchange differences
|
893
|
191
|
1,150
|
502.1%
|
28.8%
|
15,888
|
(657)
|
-104.1%
|
|
Net loss on
securities and associates
|
39,232
|
29,761
|
(15,450)
|
-151.9%
|
-139.4%
|
118,319
|
62,389
|
-47.3%
|
|
Other Income not
operational
|
32,649
|
26,028
|
52,455
|
101.5%
|
60.7%
|
94,605
|
152,442
|
61.1%
|
|
Other
Income
|
70,031
|
51,305
|
34,089
|
-33.6%
|
-51.3%
|
216,866
|
199,908
|
-7.8%
|
|
Operating expenses
|
(85,773)
|
(64,305)
|
(84,895)
|
32.0%
|
-1.0%
|
(301,815)
|
(300,773)
|
-0.3%
|
|
Other expenses
|
(35,317)
|
(24,099)
|
(25,602)
|
6.2%
|
-27.5%
|
(75,550)
|
(84,030)
|
11.2%
|
|
Total
Expenses
|
(121,090)
|
(88,404)
|
(110,497)
|
25.0%
|
-8.7%
|
(377,365)
|
(384,803)
|
2.0%
|
|
Income tax
|
(29,379)
|
(3,615)
|
(13,274)
|
267.2%
|
-54.8%
|
(40,290)
|
(44,280)
|
9.9%
|
|
Net
income
|
136,000
|
189,308
|
169,594
|
-10.4%
|
24.7%
|
810,426
|
769,774
|
-5.0%
|
From 1Q15 and on, Grupo Pacifico’s financial statements reflect the agreement with Banmedica (in equal parts) of the businesses of:
| (i) | private health insurance managed by Grupo Pacifico and included in its Financial Statements in each of the accounting lines; |
| (ii) | corporate health insurance (dependent workers); and |
| (iii) | medical services. |
The businesses described in ii) and iii) are managed by Banmedica, therefore they do not consolidate in Grupo Pacifico’s financial statements. The 50% of net income generated by Banmedica is recorded in Grupo Pacifico’s Income Statement as a gain/loss on investments in subsidiaries.
As explained before, corporate health insurance and medical services businesses are consolidated by Banmedica. The following table reflects the consolidated results from which Grupo Pacifico receives the 50% net income.
|
| |
Earnings
Release 4Q / 2024
|
Analysis
of 4Q24 Consolidated
Results
|
|
12. Appendix
|
|
Quarterly
|
%
change
|
Up
to
|
%
change
|
|||||
|
4Q23
|
3Q24
|
4Q24
|
QoQ
|
YoY
|
Dec
23
|
Dec
24
|
Dec
24 / Dec 23
|
|
|
Results
|
||||||||
|
Net earned
premiums
|
350,926
|
374,166
|
375,687
|
0.4%
|
7.1%
|
1,360,411
|
1,464,885
|
7.7%
|
|
Net claims
|
(260,201)
|
(315,869)
|
(300,166)
|
-5.0%
|
15.4%
|
(1,070,205)
|
(1,216,644)
|
13.7%
|
|
Net fees
|
(14,818)
|
(16,553)
|
(16,671)
|
0.7%
|
12.5%
|
(58,543)
|
(64,397)
|
10.0%
|
|
Net underwriting
expenses
|
(3,262)
|
(4,433)
|
(3,275)
|
-26.1%
|
0.4%
|
(12,051)
|
(14,495)
|
20.3%
|
|
Underwriting
result
|
72,645
|
37,312
|
55,574
|
48.9%
|
-23.5%
|
219,613
|
169,348
|
-22.9%
|
|
Net financial
income
|
5,035
|
5,834
|
5,304
|
-9.1%
|
5.3%
|
16,562
|
22,501
|
35.9%
|
|
Total expenses
|
(33,987)
|
(24,998)
|
(33,712)
|
34.9%
|
-0.8%
|
(99,844)
|
(110,797)
|
11.0%
|
|
Other income
|
2,036
|
1,945
|
9,389
|
382.6%
|
361.1%
|
(2,686)
|
15,795
|
-688.1%
|
|
Traslations
results
|
(1,596)
|
(2,780)
|
1,261
|
-145.4%
|
-179.1%
|
(2,423)
|
1,004
|
-141.4%
|
|
Income tax
|
(13,532)
|
(4,866)
|
(11,122)
|
128.6%
|
-17.8%
|
(44,855)
|
(28,760)
|
-35.9%
|
|
Net
income before Medical
services
|
30,602
|
12,448
|
26,695
|
114.5%
|
-12.8%
|
86,367
|
69,092
|
-20.0%
|
|
Net
income of Medical services
|
30,083
|
40,519
|
33,837
|
-16.5%
|
12.5%
|
118,449
|
138,156
|
16.6%
|
|
Net
income
|
60,685
|
52,967
|
60,531
|
14.3%
|
-0.3%
|
204,816
|
207,248
|
1.2%
|
|
| |
Earnings
Release 4Q / 2024
|
Analysis of
4Q24 Consolidated
Results
|
|
12.
Appendix
|
|
Investment
Management &
Advisory
|
Quarter
|
%
change
|
Up
to
|
%
change
|
||||
|
S/000
|
4Q23
|
3Q24
|
4Q24
|
QoQ
|
YoY
|
Dec
23
|
Dec
24
|
Dec
24 / Dec 23
|
|
Net
interest income
|
18,757
|
9,934
|
(15,640)
|
-257.4%
|
-183%
|
82,105
|
6,031
|
-92.7%
|
|
Non-financial
income
|
226,078
|
241,628
|
214,144
|
-11.4%
|
-5.3%
|
809,387
|
944,976
|
16.8%
|
|
Fee
income
|
147,019
|
157,828
|
145,476
|
-7.8%
|
-1.0%
|
530,413
|
617,225
|
16.4%
|
|
Net
gain on foreign exchange
transactions
|
14,844
|
19,448
|
15,356
|
-21.0%
|
3.4%
|
55,473
|
66,524
|
19.9%
|
|
Net
gain on sales of
securities
|
64,928
|
72,105
|
15,289
|
-78.8%
|
-76.5%
|
209,066
|
187,606
|
-10.3%
|
|
Derivative
Result
|
(16,731)
|
(17,139)
|
53,081
|
-409.7%
|
-417.3%
|
(45,497)
|
78,521
|
-272.6%
|
|
Result
from exposure to the
exchange rate
|
9,470
|
6,061
|
(21,323)
|
-451.8%
|
-325.2%
|
33,330
|
(32,613)
|
-197.8%
|
|
Other
income
|
6,548
|
3,325
|
6,265
|
88.4%
|
-4.3%
|
26,602
|
27,713
|
4.2%
|
|
Operating
expenses (1)
|
(192,097)
|
(187,915)
|
(145,999)
|
-22.3%
|
-24.0%
|
(698,702)
|
(686,698)
|
-1.7%
|
|
Operating
income
|
52,738
|
63,647
|
52,505
|
-17.5%
|
-0.4%
|
192,790
|
264,309
|
37.1%
|
|
Income
taxes
|
(10,006)
|
(11,053)
|
(22,722)
|
105.6%
|
127.1%
|
(31,394)
|
(68,660)
|
118.7%
|
|
Non-controlling
interest
|
(6,818)
|
86
|
156
|
81.4%
|
-102.3%
|
(11,955)
|
392
|
-103.3%
|
|
Net
income
|
49,550
|
52,508
|
29,627
|
-43.6%
|
-40.2%
|
173,351
|
195,257
|
12.6%
|
|
| |
Earnings
Release 4Q / 2024
|
Analysis
of 4Q24
Consolidated
Results
|
|
12.
Appendix
|
|
Table of
calculations (1)
|
||
|
Profitability
|
Interest
earning assets
|
Cash and due from banks+Total investments+Cash collateral, reverse repurchase agreements and securities borrowing+Loans |
|
Funding
|
Deposits and obligations+Due to banks and correspondents+BCRP instruments+Repurchase agreements with clients and third parties+Bonds and notes issued |
|
|
Net Interest
Margin (NIM)
|
(Net Interest Income (excluding Net Insurance Financial Expenses) (Average Interest Earning Assets) |
|
|
Risk-adjusted
Net
Interest
Margin (Risk-
adjusted NIM)
|
(Annualized Net Interest Income (excluding Net Insurance Financial Expenses)-Annualized Provisions ) (Average period end and period beginning interest earning assets ) |
|
|
Funding cost
|
(Interest Expense (Does not Include Net Insurance Financial Expenses) (Average Funding ) |
|
|
Core income
|
Net Interest Income+Fee Income+Net Gain on Foreign exchange transactions |
|
|
Other core
income
|
Fee Income+Net Gain on Foreign exchange transactions |
|
|
Other
non-core income
|
Net Gain Securities+Net Gain from associates+Net Gain of derivatives held for trading+Net Gain from exchange differences+Other non operative income |
|
|
Return on
average assets (ROA)
|
(Annualized Net Income attributable to Credicorp) (Average Assets) |
|
|
Return on
average equity (ROE)
|
(Annualized Net Income attributable to Credicorp) (Average Net Equity) |
|
|
Portfolio
quality
|
Internal
overdue ratio
|
(Internal overdue loans) (Total Loans) |
|
Non –
performing loans
ratio (NPL ratio)
|
(Internal overdue loans+Refinanced loans) (Total Loans) |
|
|
Coverage
ratio of internal
overdue loans
|
(Allowance for loans losses) (Internal overdue loans) |
|
|
Coverage
ratio of non –
performing loans
|
(Allowance for loans losses) (Non-performing loans) |
|
|
Cost of risk
|
(Annualized provision for credit losses on loans portfolio, net of recoveries ) (Average Total Loans) |
|
|
Operating
performance
|
Operating
expenses
|
Salaries and employees benefits+Administrtive expenses+Depreciation and amortization+Association in participation +Acquisition cost |
|
Operating
Income
|
Net interest, similar income, and expenses+Fee income+Net gain on foreign exchange transactions+Net gain from associates+Net gain on derivatives held for trading+Net gain from echange differences+Net Insurance Underwriting Results |
|
|
Efficiency
ratio
|
Salaries
and employee
benefits +
Administrative
expenses +
Depreciation and
amortization +
Association in
participation
Net
interest, similar
income and expenses
+ Fee Income + Net
gain on foreign
exchange
transactions + Net
gain from
associates+Net gain
on derivatives held
for trading + Result
on exchange
differences+Insurance
Underwriting Result
|
|
|
Capital
Adequacy
|
Liquidity
Coverage ratio
|
Total
High Quality
Liquid Assets +
Min(Total Inflow 30
days; 75%
* Total Outflow 30
days)
Total
Outflow 30
days
|
|
Regulatory
Capital ratio
|
(Regulatory Capital) (Risk -weighted assets) |
|
|
Tier 1 ratio
|
Tier 1(2) Risk -weighted assets |
|
|
Common Equity
Tier 1 ratio (3)
|
Capital+Reserves -100% of applicable deductions (4)+ Retained Earnings+Unrealized gains or losses Risk -weighted assets |
|
|
| |
Earnings
Release 4Q /
2024
|
Analysis
of 4Q24
Consolidated
Results
|
|
12.
Appendix
|
|
Term
|
Definition
|
||
|
AFP
|
Administradora
de Fondo de
Pensiones or Private
Pension Funds
Administrators
|
||
|
BCRP
|
Banco
Central de Reserva
del Perú or Peruvian
Central Bank
|
||
|
Financially
Included
|
Stock
of financially
included clients
through BCP since
2020. New clients
with BCP
savings
accounts or new Yape
affiliates that: (i)
Do not have debt in
the financial system
nor other BCP
products in the 12
months prior to
their inclusion,
and
(ii) Have performed
at least 3 monthly
transactions on
average through any
BCP channel in the
last 3 months
|
||
|
GMV
|
Gross
Merchant Volume
|
||
|
Government
Program Loans ("GP"
or "GP Loans")
|
Loan
Portfolio related to
Reactiva Peru,
FAE-Mype and Impulso
Myperu programs to
respond quickly and
effectively to
liquidity needs and
maintain the payment
chain
|
||
|
MAU
|
Monthly
Active Users
|
||
|
MEF
|
Ministry
of Economy and
Finance of Peru
|
||
|
TPV
|
Total
Payment Volume
|